Bexhoma Python Package
Benchmark Experiment Host Manager for Orchestration of DBMS Benchmarking Experiments in Clouds
{include} ../README.md
Example: TPC-H
This example shows how to benchmark 22 reading queries Q1-Q22 derived from TPC-H in MonetDB and PostgreSQL.
The query file is derived from the TPC-H and as such is not comparable to published TPC-H results, as the query file results do not comply with the TPC-H Specification.
Official TPC-H benchmark - http://www.tpc.org/tpch
Prerequisites
We need configuration file containing the following informations in a predefined format, c.f. demo file. The demo also includes the necessary settings for some DBMS: MariaDB, MonetDB, MySQL, OmniSci and PostgreSQL.
We may adjust the configuration to match the actual environment.
This in particular holds for imagePullSecrets, tolerations and nodeSelector in the YAML files.
For basic execution of benchmarking we need
a Kubernetes (K8s) cluster
a namespace
mynamespacekubectlusable, i.e. access token stored in a default vault like~/.kubea persistent volume named
vol-benchmarkingcontaining the raw TPC-H data in/data/tpch/SF1/
JDBC driver
./monetdb-jdbc-2.29.jarand./postgresql-42.2.5.jara folder
/benchmarksfor the results
For also enabling monitoring we need
a monitoring instance Prometheus / Grafana that scrapes metrics from
localhost:9300an access token and URL for asking Grafana for metrics
https://grafana.com/docs/grafana/latest/http_api/auth/#create-api-token
Perform Benchmark
For performing the experiment we can run the demo file.
The actual configurations to benchmark are added by
config = configurations.default(experiment=experiment, docker='MonetDB', configuration='MonetDB-{}'.format(cluster_name), alias='DBMS A')
config = configurations.default(experiment=experiment, docker='PostgreSQL', configuration='PostgreSQL-{}'.format(cluster_name), alias='DBMS D')
Adjust Parameter
You maybe want to adjust some of the parameters that are set in the file.
The hardware requirements are set via
# pick hardware
cpu = str(args.request_cpu)
memory = str(args.request_ram)
cpu_type = str(args.request_cpu_type)
Evaluate Results in Dashboard
Evaluation is done using DBMSBenchmarker: https://github.com/Beuth-Erdelt/DBMS-Benchmarker/blob/master/docs/Dashboard.html
Concepts
An experiment is a benchmark of a DBMS in a certain host setting and a specific benchmark setting.
A host setting consists of
an instance (a virtual machine)
a DBMS (as a docker image)
a volume (containing some data)
an init script (telling the dbms how to store the data)
A benchmark setting consists of
a number of client processes
a number of runs per connection
a maximum timeout
a lot more, depending on the benchmark tool
Workflow
The management roughly means
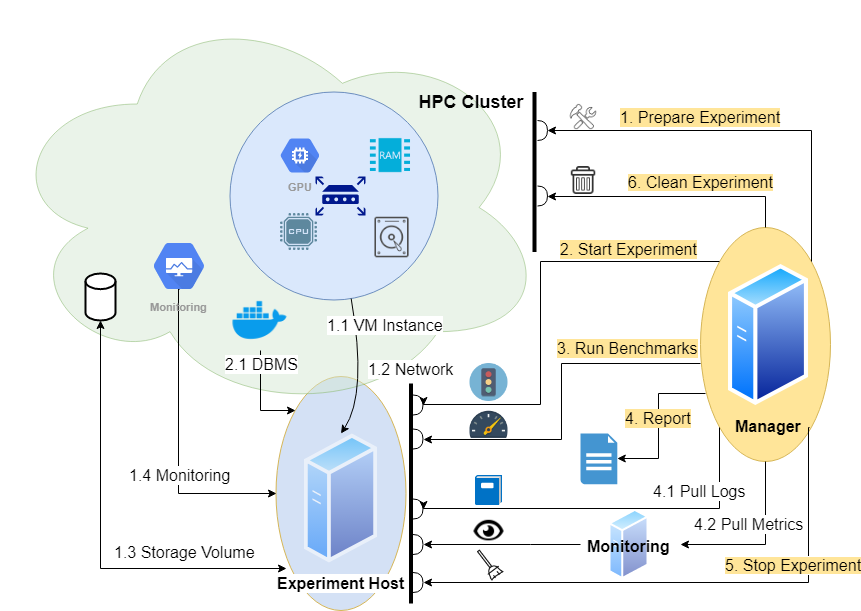
In more detail this means
Prepare Experiment
Start Virtual Machine
AWS: Start Instance EC2
k8s: Create DeploymentAttach Network
AWS: Attach EIP
k8s: Create Service, Port ForwardingAttach Data Storage Volume
AWS: Attach and Mount EBS
k8s: Attach PVCStart Monitoring
Start Prometheus Exporter Docker Container
Start Experiment
Start DBMS Docker Container
Upload and run Init Scripts
Load Data from Data Storage Volume
Run Benchmarks
Report
Pull Logs
From DBMS ContainerPull Metrics
From Grafana Monitoring Server
Stop Experiment
AWS: Stop DBMS Docker Container, Remove Docker RemnantsClean Experiment
AWS: Unmount and Detach EBS Volume, Detach EIP, Stop Instance EC2
k8s: Stop Port Forwarding, Delete Deployment and Services
Prerequisits
This tool relies on
dbms benchmarker for the actual benchmarks
boto for AWS management
paramiko for SSH handling
scp for SCP handling
kubernetes for k8s management
and some more python libraries
How to configure an experiment setup
We need
a config file containing cluster information , say
cluster.configa config folder for the benchmark tool, say
experiments/tpch/, containing a config filequeries.configfor the queriessome additional data depending on if it is an AWS or a k8s cluster
a python script managing the experimental workflow, say
experiment-tpch.py
Clusterconfig
The configuration of the cluster, that is the possible host settings, consists of these parts (see also example config file):
Result folder for the benchmark tool:
'benchmarker': {
    'resultfolder': '/benchmarks' # Local path to results folder of benchmark tool
},
Information about the volumes containing the raw data for the DBMS to import. We also set a named list of import scripts per data set:
'volumes': {
    'tpch': { # Volume: Name
        'initscripts': {
            '1shard-SF1': [ # Init Script: Name
                'initschema-tpch.sql',
                'initdata-tpch-SF1.sql'
            ],
            '4shard-SF1': [ # Init Script: Name
                'initschema-tpch-4shards.sql',
                'initdata-tpch-SF1.sql'
            ],
        }
    },
    'gdelt': { # Volume: Name
        'initscripts': {
            '1shard': [ # Init Script: Name
                'initschema-gdelt.sql',
                'initdata-gdelt.sql'
            ],
            '4shard-time': [ # Init Script: Name
                'initschema-gdelt-4shards.sql',
                'initdata-gdelt.sql'
            ],
        }
    }
},
Information about the DBMS to use:
'dockers': {
    'OmniSci': {
        'loadData': 'bin/omnisql -u admin -pHyperInteractive < {scriptname}', # DBMS: Command to Login and Run Scripts
        'template': { # Template for Benchmark Tool
            'version': 'CE v4.7',
            'alias': '',
            'JDBC': {
                'driver': 'com.omnisci.jdbc.OmniSciDriver',
                'url': 'jdbc:omnisci:{serverip}:9091:omnisci',
                'auth': {'user': 'admin', 'password': 'HyperInteractive'},
                'jar': 'omnisci-jdbc-4.7.1.jar' # DBMS: Local Path to JDBC Jar
            }
        },
        'logfile': '/omnisci-storage/data/mapd_log/omnisci_server.INFO', # DBMS: Path to Log File on Server
        'datadir': '/omnisci-storage/data/mapd_data/', # DBMS: Path to directory containing data storage
        'priceperhourdollar': 0.0, # DBMS: Price per hour in USD if DBMS is rented
    }
}
This requires
a base name for the DBMS
a prepared docker image of the DBMS
with an open port for a JDBC connection
a placeholder
templatefor the benchmark toolthe JDBC driver jar locally available
a command running the init scripts with
{scriptname}as a placeholder for the script name inside the container{serverip}as a placeholder for the host address (localhost for k8s, an Elastic IP for AWS)an optional
priceperhourdollar
On k8s
We need to add to the config file
'credentials': {
    'k8s': {
        'namespace': 'mynamespace', # K8s: Namespace of User
        'clustername': 'My_k8s_cluster', # K8s: Name of Cluster (just for annotation)
        'appname': 'dbmsbenchmarker', # K8s: To find corresponding deployments etc labels: app:
        'port': 9091 # K8s: Local port for connecting via JDBC after port forwarding
    }
}
This will tell the tool how to adress the cluster. An access token has to be installed at ~/.kube/config with the corresponding namespace and all deployments, services, pods and pvcs of this tool will be recognized by
metadata:
  labels:
    app: dbmsbenchmarker
We also need to add for each DBMS which port we have to forward
'dockers': {
    'OmniSci': {
        'port': 3306, # k8s: remote port of the DBMC for connecting via JDBC
    }
}
For the deployments we either need yaml files containing all necessary information, i.e.
Deployment with container information
Service for networking
PVC for local storage
or we need a template yaml file, c.f. how to generate deployments and an example.
On AWS
We additionally need
'credentials': {
    'AWS': {
        'AWS_Access_Key_ID': '', # AWS Access: Key ID
        'AWS_Secret_Access_Key': '', # AWS Access: Secret Access Key
        'Default_region': 'eu-central-1', # AWS Access: Default region
        'monitor': {
            'grafanatoken': 'Bearer 46363756756756476754756745', # Grafana: Access Token
            'grafanaurl': 'http://127.0.0.1:3000/api/datasources/proxy/1/api/v1/', # Grafana: API URL
            'exporter': {
                'dcgm': docker run --runtime=nvidia --name gpu_monitor_dcgm --rm -d --publish 8000:8000 1234.dkr.ecr.eu-central-1.amazonaws.com/name/dcgm:latest',
                'nvlink': 'docker run --runtime=nvidia --name gpu_monitor_nvlink --rm -d --publish 8001:8001 1234.dkr.ecr.eu-central-1.amazonaws.com/name/nvlink:latest',
                'node': 'docker run --name cpu_monitor_prom --rm -d --publish 9100:9100 prom/node-exporter:latest'
            }
        },
        'worker': {
            'ip': '127.1.2.3', # Elastic IP: IP Address
            'allocid': 'eipalloc-1234512345', # Elastic IP: Allocation ID
            'ppk': 'cluster.pem', # SSH: Local path to private key for acccessing instances in AWS cluster
            'username': 'ubuntu', # SSH: User name
        },
    }
}
and for each volume an AWS Volume ID
'volumes': {
    'tpch': { # Volume: Name
        'id': 'vol-1234512345', # AWS Volume ID
    },
    'gdelt': { # Volume: Name
        'id': 'vol-9876987655', # AWS Volume ID
    }
},
and for each instance some basic information
'instances': {
    '1xK80': { # Instance: Name
        'id': 'i-918273764645', # Instance: Id
        'type': 'p2.xlarge', # Instance: Type
        'priceperhourdollar': 1.326, # Instance: Price per hour (on demand)
        'device': 'sdf', # Instance: Device name ec2volume.attach_to_instance(/dev/$device)
        'deviceMount': 'xvdf', # Instance: Device mount name - 'sudo mount /dev/$deviceMount /data'
        'RAM': '64G', # Instance: RAM
        'GPU': '1xK80' # Instance: GPUs
    },
    '8xK80': { # Instance: Name
        'id': 'i-192838475655', # Instance: Id
        'type': 'p2.8xlarge', # Instance: Type
        'priceperhourdollar': 10.608, # Instance: Price per hour (on demand)
        'device': 'sdf', # Instance: Device name ec2volume.attach_to_instance(/dev/$device)
        'deviceMount': 'xvdf', # Instance: Device mount name - 'sudo mount /dev/$deviceMount /data'
        'RAM': '480G', # Instance: RAM
        'GPU': '8xK80' # Instance: GPUs
    },
},
and for each DBMS the image source and docker command
'dockers': {
    'OmniSci': {
        'image': 'eu-central-1.amazonaws.com/myrepository/dbms:omnisci', # ECR: Path to DBMS Docker Image
        'start': 'docker run -d --runtime=nvidia --name benchmark -p 6273:6273 -p 6275-6280:6275-6280 -p 9091:6274 -v /data:/data/ ', # Docker: Part of Command to Start Container
    }
}
This requires
A managing host having access to AWS
typically this means an
~/.awsdirectory with config and credentials files
EC2 instances as experiment hosts having
aws cli installed
docker installed
required ports open
EIP for attaching to the current experiment host
EBS volumes containing raw data
Optionally: ECR for simple docker registry
Monitoring
Monitoring requires
A server having Prometheus installed
With Prometheus scraping the fixed EIP for a fixed list of ports
A server (the same) having Grafana installed
With Grafana importing metrics from Prometheus
grafanatokenandgrafanaurlto access this from DBMSBenchmarker
A dict of exporters given as docker commands
Will be installed and activated automatically at each instance when
cluster.prepareExperiment()is invoked.
More information can be found here
DBMS
To include a DBMS in a Kubernetes-based experiment you will need
a Docker Image
a JDBC Driver
a Kubernetes Deployment Template
some configuration
How to load data (DDL command)
DDL scripts
How to connect via JDBC
This document contains examples for
Example Explained
Deployment
See documentation of deployments.
Configuration
'dockers': {
    'OmniSci': {
        'loadData': 'bin/omnisql -u admin -pHyperInteractive < {scriptname}',     # DBMS: Command to Login and Run Scripts
        'template': {                                                             # Template for Benchmark Tool
            'version': 'CE v5.4',
            'alias': 'GPU',
            'docker_alias': 'GPU',
            'JDBC': {
                'driver': 'com.omnisci.jdbc.OmniSciDriver',
                'url': 'jdbc:omnisci:{serverip}:9091:omnisci',
                'auth': {'user': 'admin', 'password': 'HyperInteractive'},
                'jar': './omnisci-jdbc-4.7.1.jar'                                   # DBMS: Local Path to JDBC Jar
            }
        },
        'logfile': '/omnisci-storage/data/mapd_log/omnisci_server.INFO',          # DBMS: Path to Log File on Server
        'datadir': '/omnisci-storage/data/mapd_data/',                            # DBMS: Path to directory containing data storage
        'priceperhourdollar': 0.0,                                                # DBMS: Price per hour in USD if DBMS is rented
    }
}
This has
a base name for the DBMS
a placeholder
templatefor the benchmark toolthe JDBC driver jar locally available
a command
loadDatafor running the init scripts with{scriptname}as a placeholder for the script name inside the container{serverip}as a placeholder for the host address (localhost for k8s, an Elastic IP for AWS){dbname}as a placeholder for the db namean optional
priceperhourdollaran optional name of a
logfilethat is downloaded after the benchmarkname of the
datadirof the DBMS. It’s size is measured usingduafter data loading has been finished.
MariaDB
Deployment
Configuration
'MariaDB': {
     'loadData': 'mysql < {scriptname}',
     'template': {
         'version': 'v10.4.6',
         'alias': 'GP A',
         'docker_alias': 'GP A',
         'dialect': 'MySQL',
         'JDBC': {
             'driver': "org.mariadb.jdbc.Driver",
             'auth': ["root", ""],
             'url': 'jdbc:mysql://{serverip}:9091/{dbname}',
             'jar': './mariadb-java-client-2.3.0.jar'
         }
     },
     'logfile': '',
     'datadir': '/var/lib/mysql/',
     'priceperhourdollar': 0.0,
 },
**DDL Scripts**
Example for TPC-H
MonetDB
Deployment
Configuration
'MonetDB': {
     'loadData': 'cd /home/monetdb;mclient db < {scriptname}',
     'template': {
         'version': 'v11.31.7',
         'alias': 'In-Memory C',
         'docker_alias': 'In-Memory C',
          'JDBC': {
             'auth': ['monetdb', 'monetdb'],
             'driver': 'nl.cwi.monetdb.jdbc.MonetDriver',
             'jar': './monetdb-jdbc-2.29.jar',
             'url': 'jdbc:monetdb://{serverip}:9091/db'
         }
     },
     'logfile': '',
     'datadir': '/var/monetdb5/',
     'priceperhourdollar': 0.0,
 },
**DDL Scripts**
Example for TPC-H
OmniSci
Deployment
Configuration
'OmniSci': {
    'loadData': 'bin/omnisql -u admin -pHyperInteractive < {scriptname}',
    'template': {
        'version': 'CE v4.7',
        'alias': 'GPU A',
        'docker_alias': 'GPU A',
        'JDBC': {
            'driver': 'com.omnisci.jdbc.OmniSciDriver',
            'url': 'jdbc:omnisci:{serverip}:9091:omnisci',
            'auth': {'user': 'admin', 'password': 'HyperInteractive'},
            'jar': './omnisci-jdbc-4.7.1.jar'
        }
    },
    'logfile': '/omnisci-storage/data/mapd_log/omnisci_server.INFO',
    'datadir': '/omnisci-storage/',
    'priceperhourdollar': 0.0,
},
**DDL Scripts**
Example for TPC-H
PostgreSQL
Deployment
Configuration
'PostgreSQL': {
    'loadData': 'psql -U postgres < {scriptname}',
    'template': {
        'version': 'v11.4',
        'alias': 'GP D',
        'docker_alias': 'GP D',
        'JDBC': {
            'driver': "org.postgresql.Driver",
            'auth': ["postgres", ""],
            'url': 'jdbc:postgresql://{serverip}:9091/postgres',
            'jar': './postgresql-42.2.5.jar'
        }
    },
    'logfile': '',
    'datadir': '/var/lib/postgresql/data/',
    'priceperhourdollar': 0.0,
},
**DDL Scripts**
Example for TPC-H
Deployments in Kubernetes
The deployment is expected to be given as a file named 'deployment-'+docker+'-'+instance+'.yml'
Such files are generated from a template.
Content of this document:
How do templates work
What templates are included
Adjust the templates to your cluster
How to parametrize templates at runtime
Templates
Template files are named 'deploymenttemplate-"+docker+".yml'.
To generate a file 'deployment-'+docker+'-'+instance+'.yml' from this
the instance name is understood as
cpu-mem-gpu-gputypethe yaml file is changed as
dep['spec']['template']['spec']['containers'][0]['resources']['requests']['cpu'] = cpu
dep['spec']['template']['spec']['containers'][0]['resources']['limits']['cpu'] = cpu
dep['spec']['template']['spec']['containers'][0]['resources']['requests']['memory'] = mem
dep['spec']['template']['spec']['containers'][0]['resources']['limits']['memory'] = mem
dep['spec']['template']['spec']['nodeSelector']['gpu'] = gputype
dep['spec']['template']['spec']['containers'][0]['resources']['limits']['nvidia.com/gpu'] = int(gpu)
Included
This repository includes some templates at https://github.com/Beuth-Erdelt/Benchmark-Experiment-Host-Manager/tree/master/k8s
DBMS included are:
MariaDB (10.4.6)
MonetDB (11.31.7)
OmniSci (v5.4.0)
PostgreSQL (11.4)
To be added in near future:
Exasol (7.0.0)
You will need a Docker image including EXAplusMemSQL (centos-7.1.8-43a12901be-2.0.0-1.7.0)
You will have to add a licence keyMySQL (8.0.21)
You will need a Docker image including tarOracle DB (18.4.0-xe)
You will need to build the Docker imageMS SQL Server (2019-CU5-ubuntu-18.04)
Your Cluster
To make these work, you may have to add the name of your Docker pull secret and the name of your persistant volume.
The default name of the secret is private-registry-auth:
imagePullSecrets:
- {name: private-registry-auth}
The default name of the PV is volume-benchmarking:
- name: benchmark-data-volume
  persistentVolumeClaim: {claimName: volume-benchmarking}
Parametrize Templates
The resources (requests, limits and nodeSelector) can also be set explicitly using
cluster.set_resources(
  requests = {
    'cpu': cpu,
    'memory': mem
  },
  limits = {
    'cpu': 0,     # unlimited
    'memory': 0   # unlimited
  },
  nodeSelector = {
    'cpu': cpu_type,
    'gpu': gpu_type,
  })
For further information and option see the documentation.
Monitoring
To include monitoring you will need
a Prometheus server scraping a fixed IP / Port
a Grafana server collecting metrics from the Prometheus server
some configuration what metrics to collect
This document contains information about the
Concept
There is
an Experiment Host - this needs Prometheus exporters
a Monitor - this needs a Prometheus server and a Grafana server scraping the Experiment Host
a Manager - this needs a configuration (which metrics to collect and where from)
Installation
To be documented
Kubernetes
Experiment Host: Exporters are part of the deployments
Monitor: Servers are deployed using Docker images, fixed on a separate monitoring instance
Manager: See configuration
AWS
Experiment Host: Exporters are deployed using Docker images, fixed on the benchmarked instance
Monitor: Servers are deployed using Docker images, fixed on a separate monitoring instance
Manager: See configuration
Configuration
We insert information about
the Grafana server
access token
URL
the collection
extension of measure intervals
time shift
metrics definitions
into the cluster configuration. This is handed over to the DBMS configuration of the benchmarker in a monitoring section.
Example
The details of the metrics correspond to the YAML configuration of the deployments:
job="monitor-node"container_name="dbms"
'monitor': {
    'grafanatoken': 'Bearer ABCDE==',
    'grafanaurl': 'http://localhost:3000/api/datasources/proxy/1/api/v1/',
    'grafanaextend': 20,
    'grafanashift': 0,
    'prometheus_url': 'http://localhost:9090/api/v1/',
    'metrics': {
        'total_cpu_memory': {
            'query': 'container_memory_working_set_bytes{{job="monitor-node", container_label_io_kubernetes_container_name="dbms"}}',
            'title': 'CPU Memory [MiB]'
        },
        'total_cpu_memory_cached': {
            'query': 'container_memory_usage_bytes{{job="monitor-node", container_label_io_kubernetes_container_name="dbms"}}',
            'title': 'CPU Memory Cached [MiB]'
        },
        'total_cpu_util': {
            'query': 'sum(irate(container_cpu_usage_seconds_total{{job="monitor-node", container_label_io_kubernetes_container_name="dbms"}}[1m]))',
            'title': 'CPU Util [%]'
        },
        'total_cpu_throttled': {
            'query': 'sum(irate(container_cpu_cfs_throttled_seconds_total{{job="monitor-node", container_label_io_kubernetes_container_name="dbms"}}[1m]))',
            'title': 'CPU Throttle [%]'
        },
        'total_cpu_util_others': {
            'query': 'sum(irate(container_cpu_usage_seconds_total{{job="monitor-node", container_label_io_kubernetes_container_name!="dbms",id!="/"}}[1m]))',
            'title': 'CPU Util Others [%]'
        },
        'total_cpu_util_s': {
            'query': 'sum(container_cpu_usage_seconds_total{{job="monitor-node", container_label_io_kubernetes_container_name="dbms"}})',
            'title': 'CPU Util [s]'
        },
        'total_cpu_throttled_s': {
            'query': 'sum(container_cpu_cfs_throttled_seconds_total{{job="monitor-node", container_label_io_kubernetes_container_name="dbms"}})',
            'title': 'CPU Throttle [s]'
        },
        'total_cpu_util_others_s': {
            'query': 'sum(container_cpu_usage_seconds_total{{job="monitor-node", container_label_io_kubernetes_container_name!="dbms",id!="/"}})',
            'title': 'CPU Util Others [s]'
        },
        'total_network_rx': {
            'query': 'sum(container_network_receive_bytes_total{{container_label_app="dbmsbenchmarker", job="monitor-node"}})',
            'title': 'Net Rx [b]'
        },
        'total_network_tx': {
            'query': 'sum(container_network_transmit_bytes_total{{container_label_app="dbmsbenchmarker", job="monitor-node"}})',
            'title': 'Net Tx [b]'
        },
        'total_fs_read': {
            'query': 'sum(container_fs_reads_bytes_total{{job="monitor-node", container_label_io_kubernetes_container_name="dbms"}})',
            'title': 'FS Read [b]'
        },
        'total_fs_write': {
            'query': 'sum(container_fs_writes_bytes_total{{job="monitor-node", container_label_io_kubernetes_container_name="dbms"}})',
            'title': 'FS Write [b]'
        },
        'total_gpu_util': {
            'query': 'sum(DCGM_FI_DEV_GPU_UTIL{{UUID=~"{gpuid}"}})',
            'title': 'GPU Util [%]'
        },
        'total_gpu_power': {
            'query': 'sum(DCGM_FI_DEV_POWER_USAGE{{UUID=~"{gpuid}"}})',
            'title': 'GPU Power Usage [W]'
        },
        'total_gpu_memory': {
            'query': 'sum(DCGM_FI_DEV_FB_USED{{UUID=~"{gpuid}"}})',
            'title': 'GPU Memory [MiB]'
        },
    }
}
Fine Tuning
If the Grafana server has metrics coming from general Prometheus server, that is it scrapes more exporters than just the bexhoma related, we will need to specify further which metrics we are interested in.
There is a placeholder {gpuid} that is substituted automatically by a list of GPUs present in the pod.

Benchmark Experiment Host Manager
This Python tools helps managing benchmark experiments of Database Management Systems (DBMS) in a Kubernetes-based High-Performance-Computing (HPC) cluster environment. It enables users to configure hardware / software setups for easily repeating tests over varying configurations.
It serves as the orchestrator [2] for distributed parallel benchmarking experiments in a Kubernetes Cloud. This has been tested at Amazon Web Services, Google Cloud, Microsoft Azure, IBM Cloud und Oracle Cloud and at Minikube installations.
The basic workflow is [1,2]: start a virtual machine, install monitoring software and a database management system, import data, run benchmarks (external tool) and shut down everything with a single command. A more advanced workflow is: Plan a sequence of such experiments, run plan as a batch and join results for comparison.
See the homepage and the documentation.
Installation
Download the repository: https://github.com/Beuth-Erdelt/Benchmark-Experiment-Host-Manager
Install the package
pip install bexhomaMake sure you have a working
kubectlinstalled
(Also make sure to have access to a running Kubernetes cluster - for example Minikube)Adjust configuration [tbd in detail]
Rename
k8s-cluster.configtocluster.configSet name of context, namespace and name of cluster in that file
Install data [tbd in detail]
Example for TPC-H SF=1:Run
kubectl create -f k8s/job-data-tpch-1.ymlWhen job is done, clean up with
kubectl delete job -l app=bexhoma -l component=data-sourceand
kubectl delete deployment -l app=bexhoma -l component=data-source.
Install result folder
Runkubectl create -f k8s/pvc-bexhoma-results.yml
Quickstart
The repository contains a tool for running TPC-H (reading) queries at MonetDB and PostgreSQL.
Run
tpch run -sf 1 -t 30.You can watch status using
bexperiments statuswhile running.
This is equivalent topython cluster.py status.After benchmarking has finished, run
bexperiments dashboardto connect to a dashboard. You can open dashboard in browser athttp://localhost:8050.
This is equivalent topython cluster.py dashboard
Alternatively you can open a Jupyter notebook athttp://localhost:8888.
More Informations
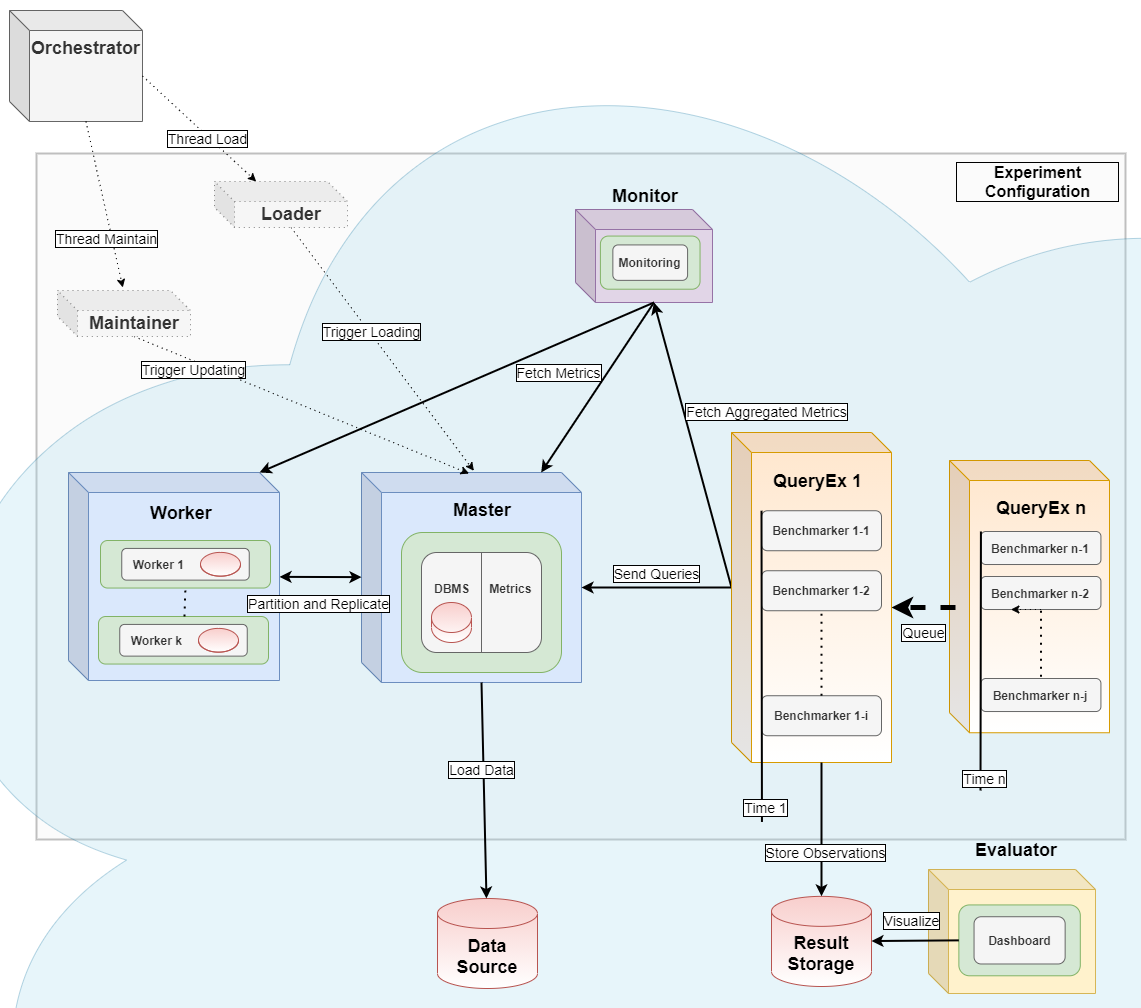
For full power, use this tool as an orchestrator as in [2]. It also starts a monitoring container using Prometheus and a metrics collector container using cAdvisor. It also uses the Python package dbmsbenchmarker as query executor [2] and evaluator [1]. See the images folder for more details.
This module has been tested with Brytlyt, Citus, Clickhouse, DB2, Exasol, Kinetica, MariaDB, MariaDB Columnstore, MemSQL, Mariadb, MonetDB, MySQL, OmniSci, Oracle DB, PostgreSQL, SingleStore, SQL Server and SAP HANA.
References
Erdelt P.K. (2021) A Framework for Supporting Repetition and Evaluation in the Process of Cloud-Based DBMS Performance Benchmarking. In: Nambiar R., Poess M. (eds) Performance Evaluation and Benchmarking. TPCTC 2020. Lecture Notes in Computer Science, vol 12752. Springer, Cham. https://doi.org/10.1007/978-3-030-84924-5_6
[2] Orchestrating DBMS Benchmarking in the Cloud with Kubernetes
Erdelt P.K. (2022) Orchestrating DBMS Benchmarking in the Cloud with Kubernetes. In: Nambiar R., Poess M. (eds) Performance Evaluation and Benchmarking. TPCTC 2021. Lecture Notes in Computer Science, vol 13169. Springer, Cham. https://doi.org/10.1007/978-3-030-94437-7_6
(old, slightly outdated docs)