Benchmark: Benchbase’s Others
Benchbase contains 18 benchmarks. In principle, all of them can be run in bexhoma. So far, only a few have been fully implemented and tested. Further examples are listed below.
The results are not official benchmark results. Exact performance depends on a number of parameters. You may get different results. These examples are solely to illustrate how to use bexhoma and show the result evaluation.
References:
OLTP-Bench: An Extensible Testbed for Benchmarking Relational Databases: http://www.vldb.org/pvldb/vol7/p277-difallah.pdf
A Cloud-Native Adoption of Classical DBMS Performance Benchmarks and Tools: https://doi.org/10.1007/978-3-031-68031-1_9
Twitter Benchmark
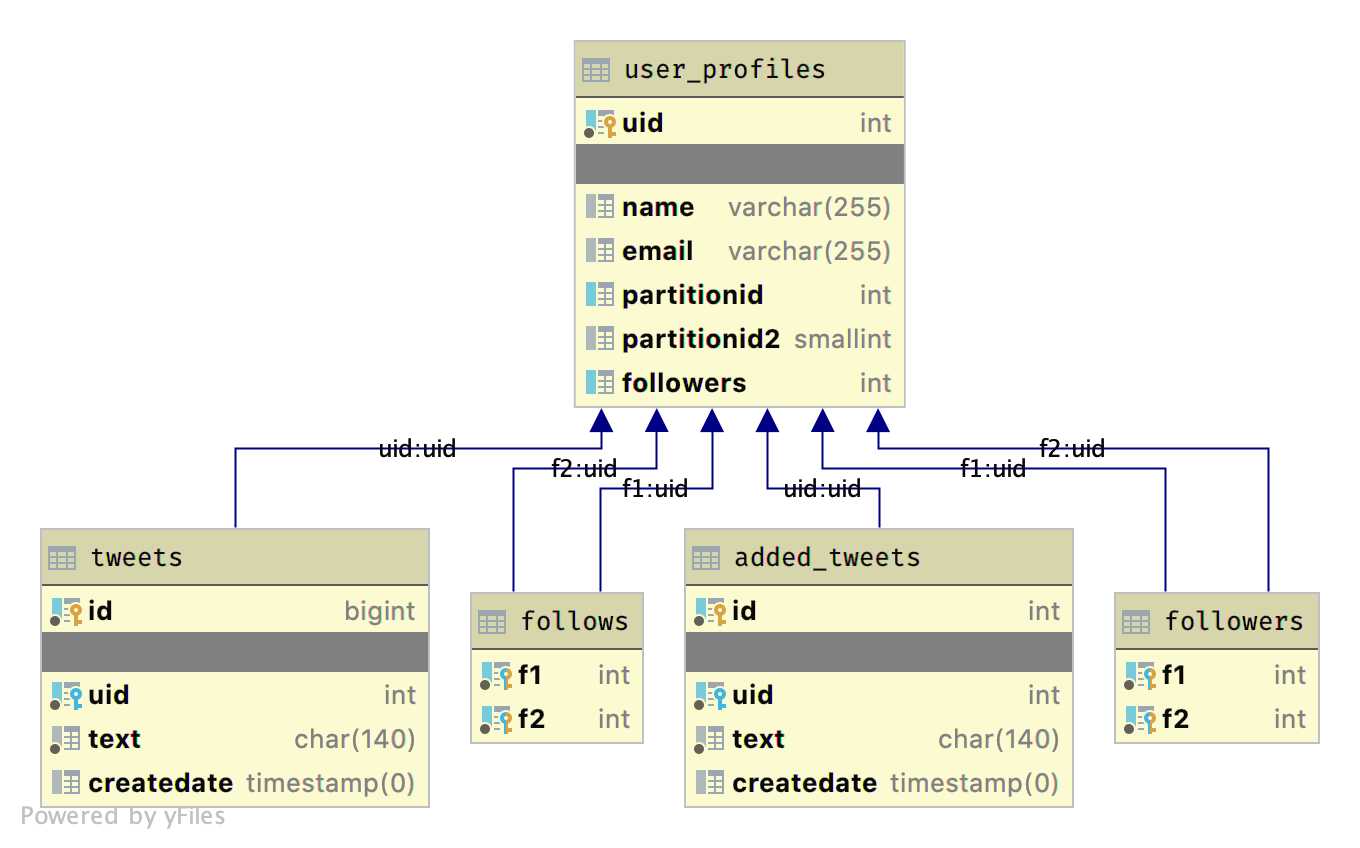
The Twitter workload is inspired by the popular micro-blogging website. In order to provide a realistic benchmark, we obtained an anonymized snapshot of the Twitter social graph from August 2009 that contains 51 million users and almost 2 billion follows relationships […]. We created a synthetic workload generator that is based on an approximation of the queries/transactions needed to support the application functionalities as we observe them by using the web site, along with information derived from a data set of 200,000 tweets. Although we do not claim that this is a precise representation of Twitter’s system, it still reflects its important characteristics, such as heavily skewed many-to-many relationships. [1]
OLTP-Bench: An Extensible Testbed for Benchmarking Relational Databases: http://www.vldb.org/pvldb/vol7/p277-difallah.pdf
Image Benchbase Twitter Benchmark: https://github.com/cmu-db/benchbase/wiki/Twitter
You will have to change the node selectors there (to names of nodes, that exist in your cluster - or to leave out the corresponding parameters):
BEXHOMA_NODE_SUT="cl-worker11"
BEXHOMA_NODE_LOAD="cl-worker19"
BEXHOMA_NODE_BENCHMARK="cl-worker19"
LOG_DIR="./logs_tests"
BEXHOMA_MS=1
BEXHOMA_STORAGE_CLASS="shared"

mkdir -p $LOG_DIR
Twitter Simple Testrun
For performing the experiment we can run the benchbase file.
Example:
bexhoma benchbase \
  -dbms PostgreSQL \
  -sf 16 \
  -xbt twitter \
  -xsd 5 \
  -xtb 1024 \
  -xnbf 16 \
  -nbp 1 \
  -nbt 16 \
  -ms $BEXHOMA_MS \
  -tr \
  -rss 50Gi \
  -rnn $BEXHOMA_NODE_SUT -rnl $BEXHOMA_NODE_LOAD -rnb $BEXHOMA_NODE_BENCHMARK \
  run &>$LOG_DIR/docs_benchbase_postgresql_twitter_simple.log
This
starts a clean instance of PostgreSQL (
-dbms)data directory inside a Docker container
starts 1 loader pod (per DBMS) that
creates the schema in the database
imports data for scale factor 16 (
-sf) (i.e., 16 * 500 the number of users) into the DBMSusing all threads of driver machine (benchbase setting)
runs streams of twitter queries (per DBMS)
running for 5 (
-xsd) minuteseach stream (pod) having 16 threads to simulate 16 users (
-nbt)-nbp: first stream 1 podtarget is 16x(
-ltf) 1024 (-xtb) ops
with a maximum of 1 DBMS per time (
-ms)tests if results match workflow (
-tr)shows a summary
Evaluate Results
At the end of a benchmark you will see a summary like
docs_benchbase_postgresql_twitter_simple.log
## Show Summary

### Workload
Benchbase Workload twitter SF=16
* Type: benchbase
* Duration: 644s
* Code: 1782066600
* Benchbase runs the Twitter benchmark.
* This experiment compares run time and resource consumption of Benchbase queries in different DBMS.
  * Benchbase data is generated and loaded using several threads.
  * Benchmark is 'twitter'. Scaling factor is 16. Target is based on multiples of '1024'. Factors for benchmarking are [16]. Benchmarking runs for 5 minutes.
  * Experiment uses bexhoma version 0.9.17.
  * Experiment is limited to DBMS ['PostgreSQL'].
  * Import is handled by 1 processes (pods).
  * Loading is fixed to cl-worker19.
  * Benchmarking is fixed to cl-worker19.
  * SUT is fixed to cl-worker38.
  * Loading is tested with [1] threads, split into [1] pods.
  * Benchmarking is tested with [16] threads, split into [1] pods.
  * Benchmarking is run as [1] times the number of benchmarking pods.
  * Experiment is run once.

### Connections
* PostgreSQL-1-1-1-1 uses docker image postgres:18.3
  * RAM:540492877824
  * CPU:Intel(R) Xeon(R) Gold 6430
  * Cores:128
  * host:6.8.0-111-generic
  * node:cl-worker38
  * disk:216444
  * cpu_list:0-127
  * args:['-c', 'max_connections=640', '-c', 'max_worker_processes=16', '-c', 'max_parallel_workers=16', '-c', 'max_parallel_workers_per_gather=8', '-c', 'max_parallel_maintenance_workers=4', '-c', 'shared_buffers=16GB', '-c', 'effective_cache_size=40GB', '-c', 'work_mem=512MB', '-c', 'maintenance_work_mem=2GB', '-c', 'autovacuum=off', '-c', 'wal_level=minimal', '-c', 'max_wal_senders=0', '-c', 'max_wal_size=32GB', '-c', 'checkpoint_timeout=1h', '-c', 'checkpoint_completion_target=1.0', '-c', 'lock_timeout=30s', '-c', 'idle_in_transaction_session_timeout=30000']
  * requests_cpu:4
  * requests_memory:16Gi
  * eval_parameters
    * code:1782066600
    * TENANT_VOL:False

### Workflow

#### Actual

* DBMS PostgreSQL-1 - Experiment 1 Client 1: benchbase (1 pods)

#### Planned

* DBMS PostgreSQL-1 - Experiment 1 Client 1: benchbase (1 pods)

### Loading

#### Per Run

|                |   experiment_run |   SF |   time_load |   time_preload |   time_generate |   time_ingest |   time_postload |   loading_pods |   terminals | tenant_id   | type_tenants   |   num_tenants | vol_tenants   |   Throughput [SF/h] |
|:---------------|-----------------:|-----:|------------:|---------------:|----------------:|--------------:|----------------:|---------------:|------------:|:------------|:---------------|--------------:|:--------------|--------------------:|
| PostgreSQL-1-1 |                1 |   16 |       43.00 |           0.00 |            0.00 |          3.00 |           40.00 |              1 |           1 |             |                |             0 | False         |             1339.53 |

### Execution

#### Per Connection

| DBMS                 | phase            | job                |   experiment_run |   terminals |   target |   client |   benchmark_run |   child |   tenant_id |   time |   num_errors |   Throughput (requests/second) |   Goodput (requests/second) |   efficiency |   Latency Distribution.95th Percentile Latency (microseconds) |   Latency Distribution.Average Latency (microseconds) |
|:---------------------|:-----------------|:-------------------|-----------------:|------------:|---------:|---------:|----------------:|--------:|------------:|-------:|-------------:|-------------------------------:|----------------------------:|-------------:|--------------------------------------------------------------:|------------------------------------------------------:|
| PostgreSQL-1-1-1-1-1 | PostgreSQL-1-1-1 | PostgreSQL-1-1-1-1 |                1 |          16 |    16384 |        1 |               1 |       1 |           0 | 300.00 |            0 |                       16384.08 |                    16384.09 |         0.00 |                                                       1024.00 |                                                551.00 |

#### Per Phase

| DBMS             | phase            |   experiment_run |   terminals |   target |   benchmark_run |   pod_count |   tenant_id |   time |   num_errors |   Throughput (requests/second) |   Goodput (requests/second) |   efficiency |   Latency Distribution.95th Percentile Latency (microseconds) |   Latency Distribution.Average Latency (microseconds) |
|:-----------------|:-----------------|-----------------:|------------:|---------:|----------------:|------------:|------------:|-------:|-------------:|-------------------------------:|----------------------------:|-------------:|--------------------------------------------------------------:|------------------------------------------------------:|
| PostgreSQL-1-1-1 | PostgreSQL-1-1-1 |                1 |          16 |    16384 |               1 |           1 |           0 | 300.00 |            0 |                       16384.08 |                    16384.09 |         0.00 |                                                       1024.00 |                                                551.00 |

### Tests
* TEST passed: Throughput (requests/second) contains no 0 or NaN
* TEST passed: Workflow as planned
SQL Scrips
The SQL scripts for pre and post ingestion can be found in https://github.com/Beuth-Erdelt/Benchmark-Experiment-Host-Manager/tree/master/experiments/benchbase/twitter
There are per DBMS
initschema-files, that are invoked before loading of datacheckschema-files, that are invoked after loading of data
You can find the output of the files in the result folder.
Twitter More Complex
bexhoma benchbase \
  -dbms PostgreSQL \
  -sf 1600 \
  -xbt twitter \
  -xsd 20 \
  -xtb 1024 \
  -xnbf 16 \
  -nbp 1,2,4,8 \
  -nbt 160 \
  -m \
  -mc \
  -ms $BEXHOMA_MS \
  -tr \
  -lr 128Gi \
  -rr 128Gi \
  -rss 1600Gi \
  -rnn $BEXHOMA_NODE_SUT -rnl $BEXHOMA_NODE_LOAD -rnb $BEXHOMA_NODE_BENCHMARK \
  run &>$LOG_DIR/docs_benchbase_postgresql_twitter_scale.log
Evaluate Results
docs_benchbase_postgresql_twitter_scale.log
## Show Summary

### Workload
Benchbase Workload twitter SF=1600
* Type: benchbase
* Duration: 5822s
* Code: 1782067250
* Benchbase runs the Twitter benchmark.
* This experiment compares run time and resource consumption of Benchbase queries in different DBMS.
  * Benchbase data is generated and loaded using several threads.
  * Benchmark is 'twitter'. Scaling factor is 1600. Target is based on multiples of '1024'. Factors for benchmarking are [16]. Benchmarking runs for 20 minutes.
  * Experiment uses bexhoma version 0.9.17.
  * System metrics are monitored by a cluster-wide installation.
  * Experiment is limited to DBMS ['PostgreSQL'].
  * Import is handled by 1 processes (pods).
  * Loading is fixed to cl-worker19.
  * Benchmarking is fixed to cl-worker19.
  * SUT is fixed to cl-worker38.
  * Loading is tested with [1] threads, split into [1] pods.
  * Benchmarking is tested with [160] threads, split into [1, 2, 4, 8] pods.
  * Benchmarking is run as [1] times the number of benchmarking pods.
  * Experiment is run once.

### Connections
* PostgreSQL-1-1-1-1 uses docker image postgres:18.3
  * RAM:540492877824
  * CPU:Intel(R) Xeon(R) Gold 6430
  * Cores:128
  * host:6.8.0-111-generic
  * node:cl-worker38
  * disk:239751
  * cpu_list:0-127
  * args:['-c', 'max_connections=640', '-c', 'max_worker_processes=16', '-c', 'max_parallel_workers=16', '-c', 'max_parallel_workers_per_gather=8', '-c', 'max_parallel_maintenance_workers=4', '-c', 'shared_buffers=16GB', '-c', 'effective_cache_size=40GB', '-c', 'work_mem=512MB', '-c', 'maintenance_work_mem=2GB', '-c', 'autovacuum=off', '-c', 'wal_level=minimal', '-c', 'max_wal_senders=0', '-c', 'max_wal_size=32GB', '-c', 'checkpoint_timeout=1h', '-c', 'checkpoint_completion_target=1.0', '-c', 'lock_timeout=30s', '-c', 'idle_in_transaction_session_timeout=30000']
  * requests_cpu:4
  * requests_memory:128Gi
  * limits_memory:128Gi
  * eval_parameters
    * code:1782067250
    * TENANT_VOL:False
* PostgreSQL-1-1-2-1 uses docker image postgres:18.3
  * RAM:540492877824
  * CPU:Intel(R) Xeon(R) Gold 6430
  * Cores:128
  * host:6.8.0-111-generic
  * node:cl-worker38
  * disk:238583
  * cpu_list:0-127
  * args:['-c', 'max_connections=640', '-c', 'max_worker_processes=16', '-c', 'max_parallel_workers=16', '-c', 'max_parallel_workers_per_gather=8', '-c', 'max_parallel_maintenance_workers=4', '-c', 'shared_buffers=16GB', '-c', 'effective_cache_size=40GB', '-c', 'work_mem=512MB', '-c', 'maintenance_work_mem=2GB', '-c', 'autovacuum=off', '-c', 'wal_level=minimal', '-c', 'max_wal_senders=0', '-c', 'max_wal_size=32GB', '-c', 'checkpoint_timeout=1h', '-c', 'checkpoint_completion_target=1.0', '-c', 'lock_timeout=30s', '-c', 'idle_in_transaction_session_timeout=30000']
  * requests_cpu:4
  * requests_memory:128Gi
  * limits_memory:128Gi
  * eval_parameters
    * code:1782067250
    * TENANT_VOL:False
* PostgreSQL-1-1-3-1 uses docker image postgres:18.3
  * RAM:540492877824
  * CPU:Intel(R) Xeon(R) Gold 6430
  * Cores:128
  * host:6.8.0-111-generic
  * node:cl-worker38
  * disk:239803
  * cpu_list:0-127
  * args:['-c', 'max_connections=640', '-c', 'max_worker_processes=16', '-c', 'max_parallel_workers=16', '-c', 'max_parallel_workers_per_gather=8', '-c', 'max_parallel_maintenance_workers=4', '-c', 'shared_buffers=16GB', '-c', 'effective_cache_size=40GB', '-c', 'work_mem=512MB', '-c', 'maintenance_work_mem=2GB', '-c', 'autovacuum=off', '-c', 'wal_level=minimal', '-c', 'max_wal_senders=0', '-c', 'max_wal_size=32GB', '-c', 'checkpoint_timeout=1h', '-c', 'checkpoint_completion_target=1.0', '-c', 'lock_timeout=30s', '-c', 'idle_in_transaction_session_timeout=30000']
  * requests_cpu:4
  * requests_memory:128Gi
  * limits_memory:128Gi
  * eval_parameters
    * code:1782067250
    * TENANT_VOL:False
* PostgreSQL-1-1-4-1 uses docker image postgres:18.3
  * RAM:540492877824
  * CPU:Intel(R) Xeon(R) Gold 6430
  * Cores:128
  * host:6.8.0-111-generic
  * node:cl-worker38
  * disk:239000
  * cpu_list:0-127
  * args:['-c', 'max_connections=640', '-c', 'max_worker_processes=16', '-c', 'max_parallel_workers=16', '-c', 'max_parallel_workers_per_gather=8', '-c', 'max_parallel_maintenance_workers=4', '-c', 'shared_buffers=16GB', '-c', 'effective_cache_size=40GB', '-c', 'work_mem=512MB', '-c', 'maintenance_work_mem=2GB', '-c', 'autovacuum=off', '-c', 'wal_level=minimal', '-c', 'max_wal_senders=0', '-c', 'max_wal_size=32GB', '-c', 'checkpoint_timeout=1h', '-c', 'checkpoint_completion_target=1.0', '-c', 'lock_timeout=30s', '-c', 'idle_in_transaction_session_timeout=30000']
  * requests_cpu:4
  * requests_memory:128Gi
  * limits_memory:128Gi
  * eval_parameters
    * code:1782067250
    * TENANT_VOL:False

### Workflow

#### Actual

* DBMS PostgreSQL-1 - Experiment 1 Client 1: benchbase (1 pods)
* DBMS PostgreSQL-1 - Experiment 1 Client 2: benchbase (2 pods)
* DBMS PostgreSQL-1 - Experiment 1 Client 3: benchbase (4 pods)
* DBMS PostgreSQL-1 - Experiment 1 Client 4: benchbase (8 pods)

#### Planned

* DBMS PostgreSQL-1 - Experiment 1 Client 1: benchbase (1 pods)
* DBMS PostgreSQL-1 - Experiment 1 Client 2: benchbase (2 pods)
* DBMS PostgreSQL-1 - Experiment 1 Client 3: benchbase (4 pods)
* DBMS PostgreSQL-1 - Experiment 1 Client 4: benchbase (8 pods)

### Loading

#### Per Run

|                |   experiment_run |   SF |   time_load |   time_preload |   time_generate |   time_ingest |   time_postload |   loading_pods |   terminals | tenant_id   | type_tenants   |   num_tenants | vol_tenants   |   Throughput [SF/h] |
|:---------------|-----------------:|-----:|------------:|---------------:|----------------:|--------------:|----------------:|---------------:|------------:|:------------|:---------------|--------------:|:--------------|--------------------:|
| PostgreSQL-1-1 |                1 | 1600 |      503.00 |           0.00 |            0.00 |        235.00 |          268.00 |              1 |           1 |             |                |             0 | False         |            11451.29 |

### Execution

#### Per Connection

| DBMS                 | phase            | job                |   experiment_run |   terminals |   target |   client |   benchmark_run |   child |   tenant_id |    time |   num_errors |   Throughput (requests/second) |   Goodput (requests/second) |   efficiency |   Latency Distribution.95th Percentile Latency (microseconds) |   Latency Distribution.Average Latency (microseconds) |
|:---------------------|:-----------------|:-------------------|-----------------:|------------:|---------:|---------:|----------------:|--------:|------------:|--------:|-------------:|-------------------------------:|----------------------------:|-------------:|--------------------------------------------------------------:|------------------------------------------------------:|
| PostgreSQL-1-1-2-1-1 | PostgreSQL-1-1-2 | PostgreSQL-1-1-2-1 |                1 |          80 |     8192 |        2 |               1 |       1 |           0 | 1200.00 |            0 |                        8192.05 |                     8192.05 |         0.00 |                                                       2468.00 |                                               1039.00 |
| PostgreSQL-1-1-2-1-2 | PostgreSQL-1-1-2 | PostgreSQL-1-1-2-1 |                1 |          80 |     8192 |        2 |               1 |       2 |           0 | 1200.00 |            0 |                        8192.04 |                     8192.05 |         0.00 |                                                       2471.00 |                                               1040.00 |
| PostgreSQL-1-1-3-1-1 | PostgreSQL-1-1-3 | PostgreSQL-1-1-3-1 |                1 |          40 |     4096 |        3 |               1 |       1 |           0 | 1200.00 |          712 |                        4095.99 |                     4095.40 |         0.00 |                                                       2471.00 |                                               1068.00 |
| PostgreSQL-1-1-3-1-2 | PostgreSQL-1-1-3 | PostgreSQL-1-1-3-1 |                1 |          40 |     4096 |        3 |               1 |       2 |           0 | 1200.00 |          777 |                        4095.99 |                     4095.35 |         0.00 |                                                       2472.00 |                                               1068.00 |
| PostgreSQL-1-1-3-1-3 | PostgreSQL-1-1-3 | PostgreSQL-1-1-3-1 |                1 |          40 |     4096 |        3 |               1 |       3 |           0 | 1200.00 |          787 |                        4095.99 |                     4095.34 |         0.00 |                                                       2481.00 |                                               1072.00 |
| PostgreSQL-1-1-3-1-4 | PostgreSQL-1-1-3 | PostgreSQL-1-1-3-1 |                1 |          40 |     4096 |        3 |               1 |       4 |           0 | 1200.00 |          775 |                        4095.99 |                     4095.35 |         0.00 |                                                       2481.00 |                                               1065.00 |
| PostgreSQL-1-1-4-1-1 | PostgreSQL-1-1-4 | PostgreSQL-1-1-4-1 |                1 |          20 |     2048 |        4 |               1 |       1 |           0 | 1200.00 |            0 |                        2048.00 |                     2048.00 |         0.00 |                                                       2135.00 |                                                996.00 |
| PostgreSQL-1-1-4-1-2 | PostgreSQL-1-1-4 | PostgreSQL-1-1-4-1 |                1 |          20 |     2048 |        4 |               1 |       2 |           0 | 1200.00 |            0 |                        2048.00 |                     2048.00 |         0.00 |                                                       2137.00 |                                                992.00 |
| PostgreSQL-1-1-4-1-3 | PostgreSQL-1-1-4 | PostgreSQL-1-1-4-1 |                1 |          20 |     2048 |        4 |               1 |       3 |           0 | 1200.00 |            0 |                        2048.00 |                     2048.00 |         0.00 |                                                       2136.00 |                                                996.00 |
| PostgreSQL-1-1-4-1-4 | PostgreSQL-1-1-4 | PostgreSQL-1-1-4-1 |                1 |          20 |     2048 |        4 |               1 |       4 |           0 | 1200.00 |            0 |                        2048.00 |                     2048.00 |         0.00 |                                                       2135.00 |                                                992.00 |
| PostgreSQL-1-1-4-1-5 | PostgreSQL-1-1-4 | PostgreSQL-1-1-4-1 |                1 |          20 |     2048 |        4 |               1 |       5 |           0 | 1200.00 |            0 |                        2048.00 |                     2048.00 |         0.00 |                                                       2135.00 |                                                994.00 |
| PostgreSQL-1-1-4-1-6 | PostgreSQL-1-1-4 | PostgreSQL-1-1-4-1 |                1 |          20 |     2048 |        4 |               1 |       6 |           0 | 1200.00 |            0 |                        2048.00 |                     2048.00 |         0.00 |                                                       2138.00 |                                                993.00 |
| PostgreSQL-1-1-4-1-7 | PostgreSQL-1-1-4 | PostgreSQL-1-1-4-1 |                1 |          20 |     2048 |        4 |               1 |       7 |           0 | 1200.00 |            0 |                        2048.00 |                     2048.00 |         0.00 |                                                       2135.00 |                                                996.00 |
| PostgreSQL-1-1-4-1-8 | PostgreSQL-1-1-4 | PostgreSQL-1-1-4-1 |                1 |          20 |     2048 |        4 |               1 |       8 |           0 | 1200.00 |            0 |                        2048.00 |                     2048.00 |         0.00 |                                                       2132.00 |                                                995.00 |

#### Per Phase

| DBMS             | phase            |   experiment_run |   terminals |   target |   benchmark_run |   pod_count |   tenant_id |    time |   num_errors |   Throughput (requests/second) |   Goodput (requests/second) |   efficiency |   Latency Distribution.95th Percentile Latency (microseconds) |   Latency Distribution.Average Latency (microseconds) |
|:-----------------|:-----------------|-----------------:|------------:|---------:|----------------:|------------:|------------:|--------:|-------------:|-------------------------------:|----------------------------:|-------------:|--------------------------------------------------------------:|------------------------------------------------------:|
| PostgreSQL-1-1-2 | PostgreSQL-1-1-2 |                1 |         160 |    16384 |               1 |           2 |           0 | 1200.00 |            0 |                       16384.09 |                    16384.10 |         0.00 |                                                       2471.00 |                                               1039.50 |
| PostgreSQL-1-1-3 | PostgreSQL-1-1-3 |                1 |         160 |    16384 |               1 |           4 |           0 | 1200.00 |         3051 |                       16383.98 |                    16381.44 |         0.00 |                                                       2481.00 |                                               1068.25 |
| PostgreSQL-1-1-4 | PostgreSQL-1-1-4 |                1 |         160 |    16384 |               1 |           8 |           0 | 1200.00 |            0 |                       16384.01 |                    16384.02 |         0.00 |                                                       2138.00 |                                                994.25 |

### Monitoring

### Loading phase: SUT deployment

| DBMS               |   CPU [CPUs] |   Max CPU |   Max RAM [Gb] |   Max RAM Cached [Gb] |
|:-------------------|-------------:|----------:|---------------:|----------------------:|
| PostgreSQL-1-1-1-1 |      2239.59 |     14.29 |           8.07 |                 12.66 |
| PostgreSQL-1-1-2-1 |      2239.59 |     14.29 |           8.07 |                 12.66 |
| PostgreSQL-1-1-3-1 |      2239.59 |     14.29 |           8.07 |                 12.66 |
| PostgreSQL-1-1-4-1 |      2239.59 |     14.29 |           8.07 |                 12.66 |

### Loading phase: component loader

| DBMS               |   CPU [CPUs] |   Max CPU |   Max RAM [Gb] |   Max RAM Cached [Gb] |
|:-------------------|-------------:|----------:|---------------:|----------------------:|
| PostgreSQL-1-1-1-1 |        80.77 |      0.71 |           0.26 |                  0.26 |
| PostgreSQL-1-1-2-1 |        80.77 |      0.71 |           0.26 |                  0.26 |
| PostgreSQL-1-1-3-1 |        80.77 |      0.71 |           0.26 |                  0.26 |
| PostgreSQL-1-1-4-1 |        80.77 |      0.71 |           0.26 |                  0.26 |

### Execution phase: SUT deployment

| DBMS               |   CPU [CPUs] |   Max CPU |   Max RAM [Gb] |   Max RAM Cached [Gb] |
|:-------------------|-------------:|----------:|---------------:|----------------------:|
| PostgreSQL-1-1-1-1 |     10404.89 |     10.26 |          14.84 |                 19.47 |
| PostgreSQL-1-1-2-1 |     10182.45 |      9.29 |          14.86 |                 19.53 |
| PostgreSQL-1-1-3-1 |     10261.14 |      9.01 |          14.99 |                 20.38 |
| PostgreSQL-1-1-4-1 |      9710.63 |      9.71 |          15.09 |                 22.15 |

### Execution phase: component benchmarker

| DBMS               |   CPU [CPUs] |   Max CPU |   Max RAM [Gb] |   Max RAM Cached [Gb] |
|:-------------------|-------------:|----------:|---------------:|----------------------:|
| PostgreSQL-1-1-1-1 |      2860.60 |      2.72 |           2.42 |                  2.80 |
| PostgreSQL-1-1-2-1 |      2860.60 |      4.79 |           2.42 |                  2.80 |
| PostgreSQL-1-1-3-1 |      3162.83 |      6.73 |           1.44 |                  1.63 |
| PostgreSQL-1-1-4-1 |      3425.68 |      8.83 |           0.79 |                  0.79 |

### Tests
* TEST passed: Loading phase: SUT deployment contains no 0 or NaN in CPU [CPUs]
* TEST passed: Loading phase: component loader contains no 0 or NaN in CPU [CPUs]
* TEST passed: Execution phase: SUT deployment contains no 0 or NaN in CPU [CPUs]
* TEST passed: Execution phase: component benchmarker contains no 0 or NaN in CPU [CPUs]
* TEST passed: Throughput (requests/second) contains no 0 or NaN
* TEST passed: Workflow as planned
CH-benCHmark
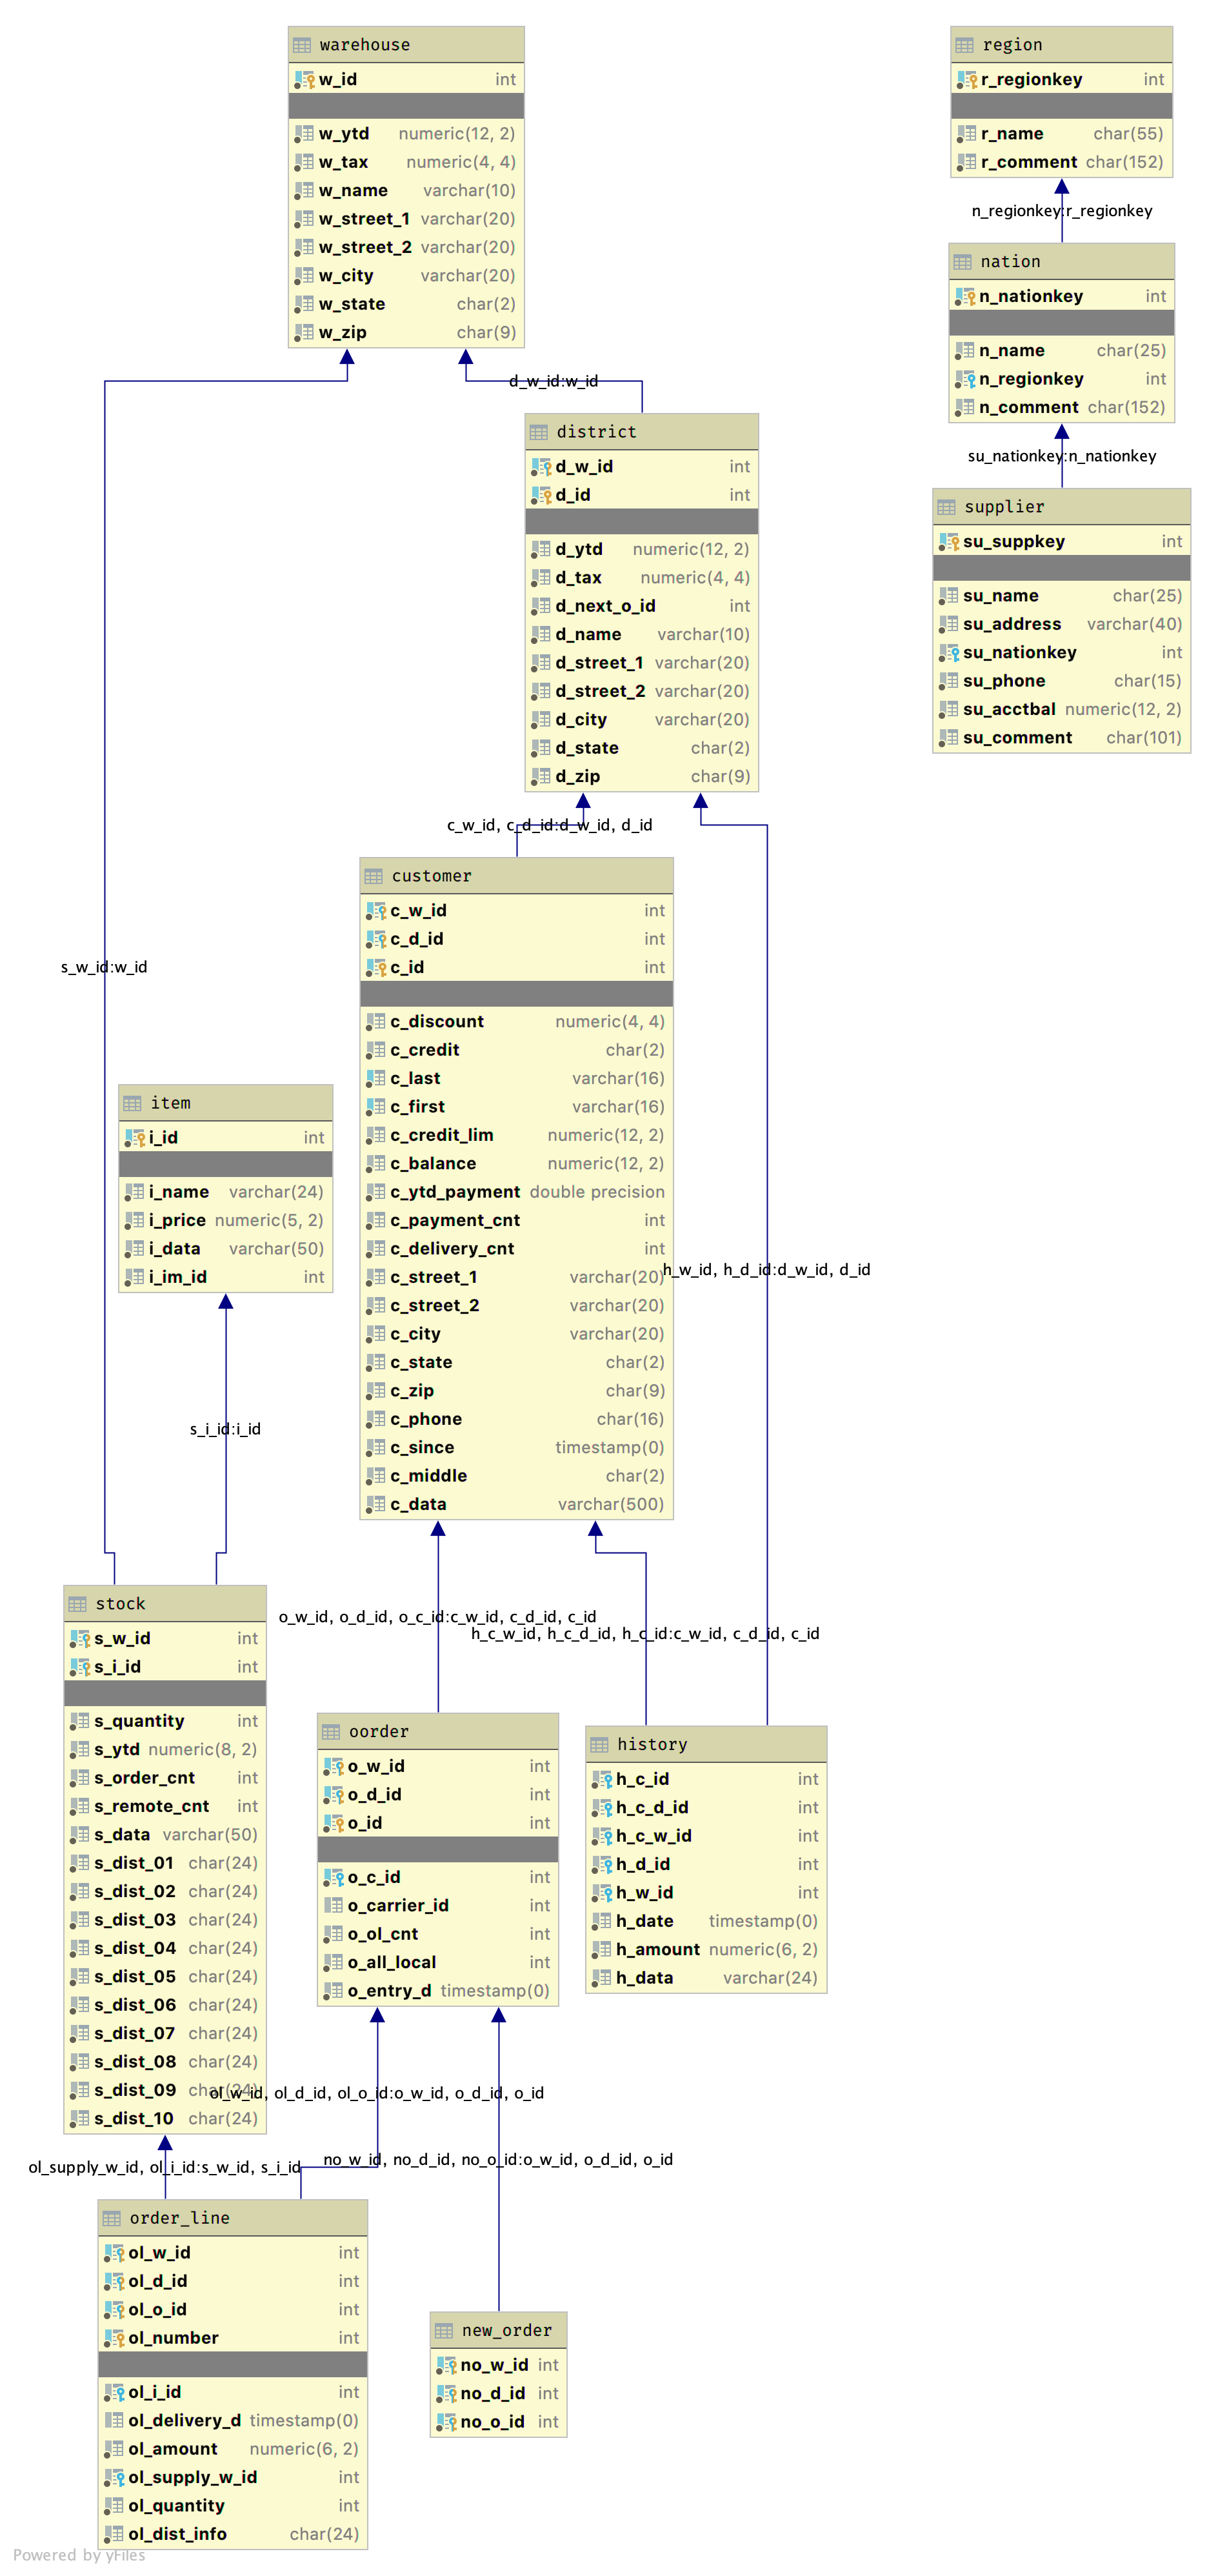
This is a mixed workload derived from TPC-Cand TPC-H […]. It is useful to evaluate DBMSs designed to serve both OLTP and OLAP workloads. The implementation leverages the ability of OLTP-Bench to run multiple workloads. It uses our built-in implementation of TPC-C along with 22 additional analytical queries. [1]
OLTP-Bench: An Extensible Testbed for Benchmarking Relational Databases: http://www.vldb.org/pvldb/vol7/p277-difallah.pdf
Image Benchbase CH-benCHmark: https://github.com/cmu-db/benchbase/wiki/CH-benCHmark
CH-benCHmark: https://db.in.tum.de/research/projects/CHbenCHmark/?lang=en
You will have to change the node selectors there (to names of nodes, that exist in your cluster - or to leave out the corresponding parameters):
BEXHOMA_NODE_SUT="cl-worker11"
BEXHOMA_NODE_LOAD="cl-worker19"
BEXHOMA_NODE_BENCHMARK="cl-worker19"
LOG_DIR="./logs_tests"
BEXHOMA_MS=1
BEXHOMA_STORAGE_CLASS="shared"

mkdir -p $LOG_DIR
CH-benCHmark Simple Testrun
For performing the experiment we can run the benchbase file.
Example:
bexhoma benchbase \
  -dbms PostgreSQL \
  -sf 10 \
  -xbt chbenchmark \
  -xsd 5 \
  -xtb 1024 \
  -xnbf 16 \
  -nbp 1 \
  -nbt 100 \
  -ms $BEXHOMA_MS \
  -tr \
  -rss 50Gi \
  -rnn $BEXHOMA_NODE_SUT -rnl $BEXHOMA_NODE_LOAD -rnb $BEXHOMA_NODE_BENCHMARK \
  run &>$LOG_DIR/docs_benchbase_postgresql_chbenchmark_simple.log
This
starts a clean instance of PostgreSQL (
-dbms)data directory inside a Docker container
starts 1 loader pod (per DBMS) that
creates the schema in the database
imports data for scale factor 16 (
-sf) (i.e., 16 * 500 the number of users) into the DBMSusing all threads of driver machine (benchbase setting)
runs streams of twitter queries (per DBMS)
running for 5 (
-xsd) minuteseach stream (pod) having 16 threads to simulate 16 users (
-nbt)-nbp: first stream 1 podtarget is 16x(
-ltf) 1024 (-xtb) ops
with a maximum of 1 DBMS per time (
-ms)tests if results match workflow (
-tr)shows a summary
Evaluate Results
At the end of a benchmark you will see a summary like
docs_benchbase_postgresql_chbenchmark_simple.log
## Show Summary

### Workload
Benchbase Workload chbenchmark SF=10
* Type: benchbase
* Duration: 876s
* Code: 1782073116
* Benchbase runs the CH-Benchmark benchmark.
* This experiment compares run time and resource consumption of Benchbase queries in different DBMS.
  * Benchbase data is generated and loaded using several threads.
  * Benchmark is 'chbenchmark'. Scaling factor is 10. Target is based on multiples of '1024'. Factors for benchmarking are [16]. Benchmarking runs for 5 minutes.
  * Experiment uses bexhoma version 0.9.17.
  * Experiment is limited to DBMS ['PostgreSQL'].
  * Import is handled by 1 processes (pods).
  * Loading is fixed to cl-worker19.
  * Benchmarking is fixed to cl-worker19.
  * SUT is fixed to cl-worker38.
  * Loading is tested with [1] threads, split into [1] pods.
  * Benchmarking is tested with [100] threads, split into [1] pods.
  * Benchmarking is run as [1] times the number of benchmarking pods.
  * Experiment is run once.

### Connections
* PostgreSQL-1-1-1-1 uses docker image postgres:18.3
  * RAM:540492877824
  * CPU:Intel(R) Xeon(R) Gold 6430
  * Cores:128
  * host:6.8.0-111-generic
  * node:cl-worker38
  * disk:222640
  * cpu_list:0-127
  * args:['-c', 'max_connections=640', '-c', 'max_worker_processes=16', '-c', 'max_parallel_workers=16', '-c', 'max_parallel_workers_per_gather=8', '-c', 'max_parallel_maintenance_workers=4', '-c', 'shared_buffers=16GB', '-c', 'effective_cache_size=40GB', '-c', 'work_mem=512MB', '-c', 'maintenance_work_mem=2GB', '-c', 'autovacuum=off', '-c', 'wal_level=minimal', '-c', 'max_wal_senders=0', '-c', 'max_wal_size=32GB', '-c', 'checkpoint_timeout=1h', '-c', 'checkpoint_completion_target=1.0', '-c', 'lock_timeout=30s', '-c', 'idle_in_transaction_session_timeout=30000']
  * requests_cpu:4
  * requests_memory:16Gi
  * eval_parameters
    * code:1782073116
    * TENANT_VOL:False

### Workflow

#### Actual

* DBMS PostgreSQL-1 - Experiment 1 Client 1: benchbase (1 pods)

#### Planned

* DBMS PostgreSQL-1 - Experiment 1 Client 1: benchbase (1 pods)

### Loading

#### Per Run

|                |   experiment_run |   SF |   time_load |   time_preload |   time_generate |   time_ingest |   time_postload |   loading_pods |   terminals | tenant_id   | type_tenants   |   num_tenants | vol_tenants   |   Throughput [SF/h] |
|:---------------|-----------------:|-----:|------------:|---------------:|----------------:|--------------:|----------------:|---------------:|------------:|:------------|:---------------|--------------:|:--------------|--------------------:|
| PostgreSQL-1-1 |                1 |   10 |      175.00 |           1.00 |            0.00 |         68.00 |          106.00 |              1 |           1 |             |                |             0 | False         |              205.71 |

### Execution

#### Per Connection

| DBMS                 | phase            | job                |   experiment_run |   terminals |   target |   client |   benchmark_run |   child |   tenant_id |   time |   num_errors |   Throughput (requests/second) |   Goodput (requests/second) |   efficiency |   Latency Distribution.95th Percentile Latency (microseconds) |   Latency Distribution.Average Latency (microseconds) |
|:---------------------|:-----------------|:-------------------|-----------------:|------------:|---------:|---------:|----------------:|--------:|------------:|-------:|-------------:|-------------------------------:|----------------------------:|-------------:|--------------------------------------------------------------:|------------------------------------------------------:|
| PostgreSQL-1-1-1-1-1 | PostgreSQL-1-1-1 | PostgreSQL-1-1-1-1 |                1 |         100 |    16384 |        1 |               1 |       1 |           0 | 300.00 |           56 |                           8.75 |                        8.90 |         0.00 |                                                   17091791.00 |                                            5774498.00 |

#### Per Phase

| DBMS             | phase            |   experiment_run |   terminals |   target |   benchmark_run |   pod_count |   tenant_id |   time |   num_errors |   Throughput (requests/second) |   Goodput (requests/second) |   efficiency |   Latency Distribution.95th Percentile Latency (microseconds) |   Latency Distribution.Average Latency (microseconds) |
|:-----------------|:-----------------|-----------------:|------------:|---------:|----------------:|------------:|------------:|-------:|-------------:|-------------------------------:|----------------------------:|-------------:|--------------------------------------------------------------:|------------------------------------------------------:|
| PostgreSQL-1-1-1 | PostgreSQL-1-1-1 |                1 |         100 |    16384 |               1 |           1 |           0 | 300.00 |           56 |                           8.75 |                        8.90 |         0.00 |                                                   17091791.00 |                                            5774498.00 |

### Tests
* TEST passed: Throughput (requests/second) contains no 0 or NaN
* TEST passed: Workflow as planned
SQL Scrips
The SQL scripts for pre and post ingestion can be found in https://github.com/Beuth-Erdelt/Benchmark-Experiment-Host-Manager/tree/master/experiments/benchbase/chbenchmark
There are per DBMS
initschema-files, that are invoked before loading of datacheckschema-files, that are invoked after loading of data
You can find the output of the files in the result folder.
CH-benCHmark More Complex
bexhoma benchbase \
  -dbms PostgreSQL \
  -sf 100 \
  -xbt chbenchmark \
  -xsd 20 \
  -xtb 1024 \
  -xnbf 16 \
  -nbp 1,2,5,10 \
  -nbt 100 \
  -ms $BEXHOMA_MS \
  -tr \
  -lr 128Gi \
  -rr 128Gi \
  -rss 100Gi \
  -rnn $BEXHOMA_NODE_SUT -rnl $BEXHOMA_NODE_LOAD -rnb $BEXHOMA_NODE_BENCHMARK \
  run &>$LOG_DIR/docs_benchbase_postgresql_chbenchmark_scale.log
Evaluate Results
docs_benchbase_postgresql_chbenchmark_scale.log
## Show Summary
### Workload
Benchbase Workload chbenchmark SF=100
* Type: benchbase
* Duration: 6057s
* Code: 1782073998
* Benchbase runs the CH-Benchmark benchmark.
* This experiment compares run time and resource consumption of Benchbase queries in different DBMS.
* Benchbase data is generated and loaded using several threads.
* Benchmark is 'chbenchmark'. Scaling factor is 100. Target is based on multiples of '1024'. Factors for benchmarking are [16]. Benchmarking runs for 20 minutes.
* Experiment uses bexhoma version 0.9.17.
* Experiment is limited to DBMS ['PostgreSQL'].
* Import is handled by 1 processes (pods).
* Loading is fixed to cl-worker19.
* Benchmarking is fixed to cl-worker19.
* SUT is fixed to cl-worker38.
* Loading is tested with [1] threads, split into [1] pods.
* Benchmarking is tested with [100] threads, split into [1, 2, 5, 10] pods.
* Benchmarking is run as [1] times the number of benchmarking pods.
* Experiment is run once.
### Connections
* PostgreSQL-1-1-1-1 uses docker image postgres:18.3
* RAM:540492877824
* CPU:Intel(R) Xeon(R) Gold 6430
* Cores:128
* host:6.8.0-111-generic
* node:cl-worker38
* disk:246472
* cpu_list:0-127
* args:['-c', 'max_connections=640', '-c', 'max_worker_processes=16', '-c', 'max_parallel_workers=16', '-c', 'max_parallel_workers_per_gather=8', '-c', 'max_parallel_maintenance_workers=4', '-c', 'shared_buffers=16GB', '-c', 'effective_cache_size=40GB', '-c', 'work_mem=512MB', '-c', 'maintenance_work_mem=2GB', '-c', 'autovacuum=off', '-c', 'wal_level=minimal', '-c', 'max_wal_senders=0', '-c', 'max_wal_size=32GB', '-c', 'checkpoint_timeout=1h', '-c', 'checkpoint_completion_target=1.0', '-c', 'lock_timeout=30s', '-c', 'idle_in_transaction_session_timeout=30000']
* requests_cpu:4
* requests_memory:128Gi
* limits_memory:128Gi
* eval_parameters
* code:1782073998
* TENANT_VOL:False
* PostgreSQL-1-1-2-1 uses docker image postgres:18.3
* RAM:540492877824
* CPU:Intel(R) Xeon(R) Gold 6430
* Cores:128
* host:6.8.0-111-generic
* node:cl-worker38
* disk:246472
* cpu_list:0-127
* args:['-c', 'max_connections=640', '-c', 'max_worker_processes=16', '-c', 'max_parallel_workers=16', '-c', 'max_parallel_workers_per_gather=8', '-c', 'max_parallel_maintenance_workers=4', '-c', 'shared_buffers=16GB', '-c', 'effective_cache_size=40GB', '-c', 'work_mem=512MB', '-c', 'maintenance_work_mem=2GB', '-c', 'autovacuum=off', '-c', 'wal_level=minimal', '-c', 'max_wal_senders=0', '-c', 'max_wal_size=32GB', '-c', 'checkpoint_timeout=1h', '-c', 'checkpoint_completion_target=1.0', '-c', 'lock_timeout=30s', '-c', 'idle_in_transaction_session_timeout=30000']
* requests_cpu:4
* requests_memory:128Gi
* limits_memory:128Gi
* eval_parameters
* code:1782073998
* TENANT_VOL:False
* PostgreSQL-1-1-3-1 uses docker image postgres:18.3
* RAM:540492877824
* CPU:Intel(R) Xeon(R) Gold 6430
* Cores:128
* host:6.8.0-111-generic
* node:cl-worker38
* disk:246472
* cpu_list:0-127
* args:['-c', 'max_connections=640', '-c', 'max_worker_processes=16', '-c', 'max_parallel_workers=16', '-c', 'max_parallel_workers_per_gather=8', '-c', 'max_parallel_maintenance_workers=4', '-c', 'shared_buffers=16GB', '-c', 'effective_cache_size=40GB', '-c', 'work_mem=512MB', '-c', 'maintenance_work_mem=2GB', '-c', 'autovacuum=off', '-c', 'wal_level=minimal', '-c', 'max_wal_senders=0', '-c', 'max_wal_size=32GB', '-c', 'checkpoint_timeout=1h', '-c', 'checkpoint_completion_target=1.0', '-c', 'lock_timeout=30s', '-c', 'idle_in_transaction_session_timeout=30000']
* requests_cpu:4
* requests_memory:128Gi
* limits_memory:128Gi
* eval_parameters
* code:1782073998
* TENANT_VOL:False
* PostgreSQL-1-1-4-1 uses docker image postgres:18.3
* RAM:540492877824
* CPU:Intel(R) Xeon(R) Gold 6430
* Cores:128
* host:6.8.0-111-generic
* node:cl-worker38
* disk:246474
* cpu_list:0-127
* args:['-c', 'max_connections=640', '-c', 'max_worker_processes=16', '-c', 'max_parallel_workers=16', '-c', 'max_parallel_workers_per_gather=8', '-c', 'max_parallel_maintenance_workers=4', '-c', 'shared_buffers=16GB', '-c', 'effective_cache_size=40GB', '-c', 'work_mem=512MB', '-c', 'maintenance_work_mem=2GB', '-c', 'autovacuum=off', '-c', 'wal_level=minimal', '-c', 'max_wal_senders=0', '-c', 'max_wal_size=32GB', '-c', 'checkpoint_timeout=1h', '-c', 'checkpoint_completion_target=1.0', '-c', 'lock_timeout=30s', '-c', 'idle_in_transaction_session_timeout=30000']
* requests_cpu:4
* requests_memory:128Gi
* limits_memory:128Gi
* eval_parameters
* code:1782073998
* TENANT_VOL:False
### Workflow
#### Actual
* DBMS PostgreSQL-1 - Experiment 1 Client 1: benchbase (1 pods)
* DBMS PostgreSQL-1 - Experiment 1 Client 2: benchbase (2 pods)
* DBMS PostgreSQL-1 - Experiment 1 Client 3: benchbase (5 pods)
* DBMS PostgreSQL-1 - Experiment 1 Client 4: benchbase (10 pods)
#### Planned
* DBMS PostgreSQL-1 - Experiment 1 Client 1: benchbase (1 pods)
* DBMS PostgreSQL-1 - Experiment 1 Client 2: benchbase (2 pods)
* DBMS PostgreSQL-1 - Experiment 1 Client 3: benchbase (5 pods)
* DBMS PostgreSQL-1 - Experiment 1 Client 4: benchbase (10 pods)
### Loading
#### Per Run
| | experiment_run | SF | time_load | time_preload | time_generate | time_ingest | time_postload | loading_pods | terminals | tenant_id | type_tenants | num_tenants | vol_tenants | Throughput [SF/h] |
|:---------------|-----------------:|-----:|------------:|---------------:|----------------:|--------------:|----------------:|---------------:|------------:|:------------|:---------------|--------------:|:--------------|--------------------:|
| PostgreSQL-1-1 | 1 | 100 | 845.00 | 1.00 | 0.00 | 412.00 | 432.00 | 1 | 1 | | | 0 | False | 426.04 |
### Execution
#### Per Connection
| DBMS | phase | job | experiment_run | terminals | target | client | benchmark_run | child | tenant_id | time | num_errors | Throughput (requests/second) | Goodput (requests/second) | efficiency | Latency Distribution.95th Percentile Latency (microseconds) | Latency Distribution.Average Latency (microseconds) |
|:----------------------|:-----------------|:-------------------|-----------------:|------------:|---------:|---------:|----------------:|--------:|------------:|--------:|-------------:|-------------------------------:|----------------------------:|-------------:|--------------------------------------------------------------:|------------------------------------------------------:|
| PostgreSQL-1-1-1-1-1 | PostgreSQL-1-1-1 | PostgreSQL-1-1-1-1 | 1 | 100 | 16384 | 1 | 1 | 1 | 0 | 1200.00 | 253 | 4.43 | 4.30 | 0.00 | 75485020.00 | 22063312.00 |
| PostgreSQL-1-1-2-1-1 | PostgreSQL-1-1-2 | PostgreSQL-1-1-2-1 | 1 | 50 | 8192 | 2 | 1 | 1 | 0 | 1200.00 | 142 | 2.38 | 2.30 | 0.00 | 75666118.00 | 20525425.00 |
| PostgreSQL-1-1-2-1-2 | PostgreSQL-1-1-2 | PostgreSQL-1-1-2-1 | 1 | 50 | 8192 | 2 | 1 | 2 | 0 | 1200.00 | 164 | 2.31 | 2.22 | 0.00 | 74845008.00 | 21061378.00 |
| PostgreSQL-1-1-3-1-1 | PostgreSQL-1-1-3 | PostgreSQL-1-1-3-1 | 1 | 20 | 3276 | 3 | 1 | 1 | 0 | 1200.00 | 72 | 0.95 | 0.91 | 0.00 | 71255355.00 | 20177586.00 |
| PostgreSQL-1-1-3-1-2 | PostgreSQL-1-1-3 | PostgreSQL-1-1-3-1 | 1 | 20 | 3276 | 3 | 1 | 2 | 0 | 1200.00 | 70 | 1.04 | 0.99 | 0.00 | 69834773.00 | 18901245.00 |
| PostgreSQL-1-1-3-1-3 | PostgreSQL-1-1-3 | PostgreSQL-1-1-3-1 | 1 | 20 | 3276 | 3 | 1 | 3 | 0 | 1200.00 | 59 | 0.98 | 0.94 | 0.00 | 70308018.00 | 19919982.00 |
| PostgreSQL-1-1-3-1-4 | PostgreSQL-1-1-3 | PostgreSQL-1-1-3-1 | 1 | 20 | 3276 | 3 | 1 | 4 | 0 | 1200.00 | 66 | 0.98 | 0.94 | 0.00 | 69611389.00 | 19875286.00 |
| PostgreSQL-1-1-3-1-5 | PostgreSQL-1-1-3 | PostgreSQL-1-1-3-1 | 1 | 20 | 3276 | 3 | 1 | 5 | 0 | 1200.00 | 44 | 0.97 | 0.95 | 0.00 | 71734297.00 | 20135318.00 |
| PostgreSQL-1-1-4-1-1 | PostgreSQL-1-1-4 | PostgreSQL-1-1-4-1 | 1 | 10 | 1638 | 4 | 1 | 1 | 0 | 1200.00 | 34 | 0.48 | 0.46 | 0.00 | 71788267.00 | 20469311.00 |
| PostgreSQL-1-1-4-1-10 | PostgreSQL-1-1-4 | PostgreSQL-1-1-4-1 | 1 | 10 | 1638 | 4 | 1 | 10 | 0 | 1200.00 | 27 | 0.44 | 0.43 | 0.00 | 77864803.00 | 21106533.00 |
| PostgreSQL-1-1-4-1-2 | PostgreSQL-1-1-4 | PostgreSQL-1-1-4-1 | 1 | 10 | 1638 | 4 | 1 | 2 | 0 | 1200.00 | 30 | 0.52 | 0.50 | 0.00 | 75221812.00 | 18831927.00 |
| PostgreSQL-1-1-4-1-3 | PostgreSQL-1-1-4 | PostgreSQL-1-1-4-1 | 1 | 10 | 1638 | 4 | 1 | 3 | 0 | 1200.00 | 22 | 0.44 | 0.44 | 0.00 | 73215565.00 | 22123438.00 |
| PostgreSQL-1-1-4-1-4 | PostgreSQL-1-1-4 | PostgreSQL-1-1-4-1 | 1 | 10 | 1638 | 4 | 1 | 4 | 0 | 1200.00 | 28 | 0.51 | 0.49 | 0.00 | 74307877.00 | 19144023.00 |
| PostgreSQL-1-1-4-1-5 | PostgreSQL-1-1-4 | PostgreSQL-1-1-4-1 | 1 | 10 | 1638 | 4 | 1 | 5 | 0 | 1200.00 | 29 | 0.43 | 0.41 | 0.00 | 87015898.00 | 22852958.00 |
| PostgreSQL-1-1-4-1-6 | PostgreSQL-1-1-4 | PostgreSQL-1-1-4-1 | 1 | 10 | 1638 | 4 | 1 | 6 | 0 | 1200.00 | 33 | 0.50 | 0.48 | 0.00 | 68972298.00 | 19282806.00 |
| PostgreSQL-1-1-4-1-7 | PostgreSQL-1-1-4 | PostgreSQL-1-1-4-1 | 1 | 10 | 1638 | 4 | 1 | 7 | 0 | 1200.00 | 29 | 0.50 | 0.48 | 0.00 | 76119365.00 | 19577412.00 |
| PostgreSQL-1-1-4-1-8 | PostgreSQL-1-1-4 | PostgreSQL-1-1-4-1 | 1 | 10 | 1638 | 4 | 1 | 8 | 0 | 1200.00 | 31 | 0.43 | 0.41 | 0.00 | 77316014.00 | 22853388.00 |
| PostgreSQL-1-1-4-1-9 | PostgreSQL-1-1-4 | PostgreSQL-1-1-4-1 | 1 | 10 | 1638 | 4 | 1 | 9 | 0 | 1200.00 | 29 | 0.46 | 0.44 | 0.00 | 74101523.00 | 21190404.00 |
#### Per Phase
| DBMS | phase | experiment_run | terminals | target | benchmark_run | pod_count | tenant_id | time | num_errors | Throughput (requests/second) | Goodput (requests/second) | efficiency | Latency Distribution.95th Percentile Latency (microseconds) | Latency Distribution.Average Latency (microseconds) |
|:-----------------|:-----------------|-----------------:|------------:|---------:|----------------:|------------:|------------:|--------:|-------------:|-------------------------------:|----------------------------:|-------------:|--------------------------------------------------------------:|------------------------------------------------------:|
| PostgreSQL-1-1-1 | PostgreSQL-1-1-1 | 1 | 100 | 16384 | 1 | 1 | 0 | 1200.00 | 253 | 4.43 | 4.30 | 0.00 | 75485020.00 | 22063312.00 |
| PostgreSQL-1-1-2 | PostgreSQL-1-1-2 | 1 | 100 | 16384 | 1 | 2 | 0 | 1200.00 | 306 | 4.69 | 4.52 | 0.00 | 75666118.00 | 20793401.50 |
| PostgreSQL-1-1-3 | PostgreSQL-1-1-3 | 1 | 100 | 16380 | 1 | 5 | 0 | 1200.00 | 311 | 4.91 | 4.74 | 0.00 | 71734297.00 | 19801883.40 |
| PostgreSQL-1-1-4 | PostgreSQL-1-1-4 | 1 | 100 | 16380 | 1 | 10 | 0 | 1200.00 | 292 | 4.70 | 4.55 | 0.00 | 87015898.00 | 20743220.00 |
### Tests
* TEST passed: Throughput (requests/second) contains no 0 or NaN
* TEST passed: Workflow as planned
YCSB Benchmark
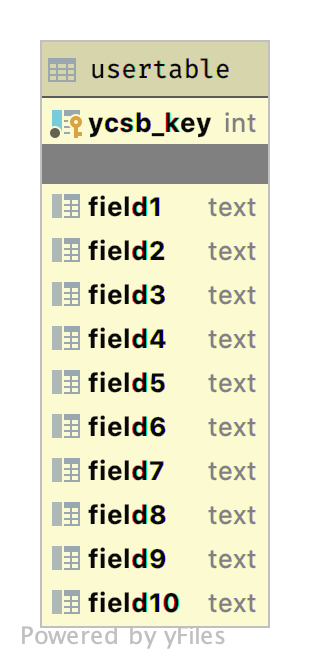
The Yahoo! Cloud Serving Benchmark (YCSB) is a collection of micro-benchmarks that represent data management applications whose workload is simple but requires high scalability [16]. Such applications are often large-scale services created by Web-based companies. Although these services are often deployed using distributed key/value storage systems, this benchmark can also provide insight into the capabilities of traditional DBMSs. [1]
OLTP-Bench: An Extensible Testbed for Benchmarking Relational Databases: http://www.vldb.org/pvldb/vol7/p277-difallah.pdf
Image Benchbase YCSB Benchmark: https://github.com/cmu-db/benchbase/wiki/YCSB
You will have to change the node selectors there (to names of nodes, that exist in your cluster - or to leave out the corresponding parameters):
BEXHOMA_NODE_SUT="cl-worker11"
BEXHOMA_NODE_LOAD="cl-worker19"
BEXHOMA_NODE_BENCHMARK="cl-worker19"
LOG_DIR="./logs_tests"
BEXHOMA_MS=1
BEXHOMA_STORAGE_CLASS="shared"

mkdir -p $LOG_DIR
YCSB Simple Testrun Workload C
For performing the experiment we can run the benchbase file.
Example:
bexhoma benchbase \
  -dbms PostgreSQL \
  -sf 1000 \
  -xbt ycsb \
  -xwl c \
  -xsd 5 \
  -xtb 1024 \
  -xnbf 16 \
  -nlt 64 \
  -nbp 1,2 \
  -nbt 32 \
  -tr \
  -rss 1000Gi \
  -rnn $BEXHOMA_NODE_SUT -rnl $BEXHOMA_NODE_LOAD -rnb $BEXHOMA_NODE_BENCHMARK \
  run &>$LOG_DIR/docs_benchbase_postgresql_ycsb_c.log
This
starts a clean instance of PostgreSQL (
-dbms)data directory inside a Docker container
starts 1 loader pod (per DBMS) that
creates the schema in the database
imports data for scale factor 1000 (
-sf) (i.e., 1000 * 1000 the number of rows) into the DBMSusing all threads of driver machine (benchbase setting)
runs streams of ycsb (
--benchmark) queries (per DBMS) workload c (--workload)running for 5 (
-xsd) minuteseach stream (pod) having 32 threads to simulate 32 users (
-nbt)-nbp: first stream 1 pod, second stream 2 podstarget is 16x(
-ltf) 1024 (-xtb) ops
with a maximum of 1 DBMS per time (
-ms)tests if results match workflow (
-tr)shows a summary
Evaluate Results
At the end of a benchmark you will see a summary like
docs_benchbase_postgresql_ycsb_c.log
## Show Summary

### Workload
Benchbase Workload ycsb SF=1000
* Type: benchbase
* Duration: 1047s
* Code: 1782080073
* Benchbase runs an YCSB experiment.
* This experiment compares run time and resource consumption of Benchbase queries in different DBMS.
  * Benchbase data is generated and loaded using several threads.
  * Benchmark is 'ycsb'. Workload is 'c'. Scaling factor is 1000. Target is based on multiples of '1024'. Factors for benchmarking are [16]. Benchmarking runs for 5 minutes.
  * Experiment uses bexhoma version 0.9.17.
  * Experiment is limited to DBMS ['PostgreSQL'].
  * Import is handled by 1 processes (pods).
  * Loading is fixed to cl-worker19.
  * Benchmarking is fixed to cl-worker19.
  * SUT is fixed to cl-worker38.
  * Loading is tested with [64] threads, split into [1] pods.
  * Benchmarking is tested with [32] threads, split into [1, 2] pods.
  * Benchmarking is run as [1] times the number of benchmarking pods.
  * Experiment is run once.

### Connections
* PostgreSQL-1-1-1-1 uses docker image postgres:18.3
  * RAM:540492877824
  * CPU:Intel(R) Xeon(R) Gold 6430
  * Cores:128
  * host:6.8.0-111-generic
  * node:cl-worker38
  * disk:222216
  * cpu_list:0-127
  * args:['-c', 'max_connections=640', '-c', 'max_worker_processes=16', '-c', 'max_parallel_workers=16', '-c', 'max_parallel_workers_per_gather=8', '-c', 'max_parallel_maintenance_workers=4', '-c', 'shared_buffers=16GB', '-c', 'effective_cache_size=40GB', '-c', 'work_mem=512MB', '-c', 'maintenance_work_mem=2GB', '-c', 'autovacuum=off', '-c', 'wal_level=minimal', '-c', 'max_wal_senders=0', '-c', 'max_wal_size=32GB', '-c', 'checkpoint_timeout=1h', '-c', 'checkpoint_completion_target=1.0', '-c', 'lock_timeout=30s', '-c', 'idle_in_transaction_session_timeout=30000']
  * requests_cpu:4
  * requests_memory:16Gi
  * eval_parameters
    * code:1782080073
    * TENANT_VOL:False
* PostgreSQL-1-1-2-1 uses docker image postgres:18.3
  * RAM:540492877824
  * CPU:Intel(R) Xeon(R) Gold 6430
  * Cores:128
  * host:6.8.0-111-generic
  * node:cl-worker38
  * disk:222216
  * cpu_list:0-127
  * args:['-c', 'max_connections=640', '-c', 'max_worker_processes=16', '-c', 'max_parallel_workers=16', '-c', 'max_parallel_workers_per_gather=8', '-c', 'max_parallel_maintenance_workers=4', '-c', 'shared_buffers=16GB', '-c', 'effective_cache_size=40GB', '-c', 'work_mem=512MB', '-c', 'maintenance_work_mem=2GB', '-c', 'autovacuum=off', '-c', 'wal_level=minimal', '-c', 'max_wal_senders=0', '-c', 'max_wal_size=32GB', '-c', 'checkpoint_timeout=1h', '-c', 'checkpoint_completion_target=1.0', '-c', 'lock_timeout=30s', '-c', 'idle_in_transaction_session_timeout=30000']
  * requests_cpu:4
  * requests_memory:16Gi
  * eval_parameters
    * code:1782080073
    * TENANT_VOL:False

### Workflow

#### Actual

* DBMS PostgreSQL-1 - Experiment 1 Client 1: benchbase (1 pods)
* DBMS PostgreSQL-1 - Experiment 1 Client 2: benchbase (2 pods)

#### Planned

* DBMS PostgreSQL-1 - Experiment 1 Client 1: benchbase (1 pods)
* DBMS PostgreSQL-1 - Experiment 1 Client 2: benchbase (2 pods)

### Loading

#### Per Run

|                |   experiment_run |   SF |   time_load |   time_preload |   time_generate |   time_ingest |   time_postload |   loading_pods |   terminals | tenant_id   | type_tenants   |   num_tenants | vol_tenants   |   Throughput [SF/h] |
|:---------------|-----------------:|-----:|------------:|---------------:|----------------:|--------------:|----------------:|---------------:|------------:|:------------|:---------------|--------------:|:--------------|--------------------:|
| PostgreSQL-1-1 |                1 | 1000 |       49.00 |           1.00 |            0.00 |          7.00 |           41.00 |              1 |           1 |             |                |             0 | False         |            73469.39 |

### Execution

#### Per Connection

| DBMS                 | phase            | job                |   experiment_run |   terminals |   target |   client |   benchmark_run |   child |   tenant_id |   time |   num_errors |   Throughput (requests/second) |   Goodput (requests/second) |   efficiency |   Latency Distribution.95th Percentile Latency (microseconds) |   Latency Distribution.Average Latency (microseconds) |
|:---------------------|:-----------------|:-------------------|-----------------:|------------:|---------:|---------:|----------------:|--------:|------------:|-------:|-------------:|-------------------------------:|----------------------------:|-------------:|--------------------------------------------------------------:|------------------------------------------------------:|
| PostgreSQL-1-1-1-1-1 | PostgreSQL-1-1-1 | PostgreSQL-1-1-1-1 |                1 |          32 |    16384 |        1 |               1 |       1 |           0 | 300.00 |            0 |                       16384.05 |                    16384.07 |         0.00 |                                                       1074.00 |                                                495.00 |
| PostgreSQL-1-1-2-1-1 | PostgreSQL-1-1-2 | PostgreSQL-1-1-2-1 |                1 |          16 |     8192 |        2 |               1 |       1 |           0 | 300.00 |            0 |                        8192.01 |                     8192.03 |         0.00 |                                                       1121.00 |                                                572.00 |
| PostgreSQL-1-1-2-1-2 | PostgreSQL-1-1-2 | PostgreSQL-1-1-2-1 |                1 |          16 |     8192 |        2 |               1 |       2 |           0 | 300.00 |            0 |                        8192.02 |                     8192.03 |         0.00 |                                                       1086.00 |                                                491.00 |

#### Per Phase

| DBMS             | phase            |   experiment_run |   terminals |   target |   benchmark_run |   pod_count |   tenant_id |   time |   num_errors |   Throughput (requests/second) |   Goodput (requests/second) |   efficiency |   Latency Distribution.95th Percentile Latency (microseconds) |   Latency Distribution.Average Latency (microseconds) |
|:-----------------|:-----------------|-----------------:|------------:|---------:|----------------:|------------:|------------:|-------:|-------------:|-------------------------------:|----------------------------:|-------------:|--------------------------------------------------------------:|------------------------------------------------------:|
| PostgreSQL-1-1-1 | PostgreSQL-1-1-1 |                1 |          32 |    16384 |               1 |           1 |           0 | 300.00 |            0 |                       16384.05 |                    16384.07 |         0.00 |                                                       1074.00 |                                                495.00 |
| PostgreSQL-1-1-2 | PostgreSQL-1-1-2 |                1 |          32 |    16384 |               1 |           2 |           0 | 300.00 |            0 |                       16384.03 |                    16384.06 |         0.00 |                                                       1121.00 |                                                531.50 |

### Tests
* TEST passed: Throughput (requests/second) contains no 0 or NaN
* TEST passed: Workflow as planned
YCSB Simple Testrun Workload A
For performing the experiment we can run the benchbase file.
Example:
bexhoma benchbase \
  -dbms PostgreSQL \
  -sf 1000 \
  -xbt ycsb \
  -xwl a \
  -xsd 5 \
  -xtb 1024 \
  -xnbf 16 \
  -nlt 64 \
  -nbp 1,2 \
  -nbt 32 \
  -tr \
  -rss 1000Gi \
  -rnn $BEXHOMA_NODE_SUT -rnl $BEXHOMA_NODE_LOAD -rnb $BEXHOMA_NODE_BENCHMARK \
  run &>$LOG_DIR/docs_benchbase_postgresql_ycsb_a.log
Evaluate Results
At the end of a benchmark you will see a summary like
docs_benchbase_postgresql_ycsb_a.log
## Show Summary

### Workload
Benchbase Workload ycsb SF=1000
* Type: benchbase
* Duration: 1048s
* Code: 1782081126
* Benchbase runs an YCSB experiment.
* This experiment compares run time and resource consumption of Benchbase queries in different DBMS.
  * Benchbase data is generated and loaded using several threads.
  * Benchmark is 'ycsb'. Workload is 'a'. Scaling factor is 1000. Target is based on multiples of '1024'. Factors for benchmarking are [16]. Benchmarking runs for 5 minutes.
  * Experiment uses bexhoma version 0.9.17.
  * Experiment is limited to DBMS ['PostgreSQL'].
  * Import is handled by 1 processes (pods).
  * Loading is fixed to cl-worker19.
  * Benchmarking is fixed to cl-worker19.
  * SUT is fixed to cl-worker38.
  * Loading is tested with [64] threads, split into [1] pods.
  * Benchmarking is tested with [32] threads, split into [1, 2] pods.
  * Benchmarking is run as [1] times the number of benchmarking pods.
  * Experiment is run once.

### Connections
* PostgreSQL-1-1-1-1 uses docker image postgres:18.3
  * RAM:540492877824
  * CPU:Intel(R) Xeon(R) Gold 6430
  * Cores:128
  * host:6.8.0-111-generic
  * node:cl-worker38
  * disk:222216
  * cpu_list:0-127
  * args:['-c', 'max_connections=640', '-c', 'max_worker_processes=16', '-c', 'max_parallel_workers=16', '-c', 'max_parallel_workers_per_gather=8', '-c', 'max_parallel_maintenance_workers=4', '-c', 'shared_buffers=16GB', '-c', 'effective_cache_size=40GB', '-c', 'work_mem=512MB', '-c', 'maintenance_work_mem=2GB', '-c', 'autovacuum=off', '-c', 'wal_level=minimal', '-c', 'max_wal_senders=0', '-c', 'max_wal_size=32GB', '-c', 'checkpoint_timeout=1h', '-c', 'checkpoint_completion_target=1.0', '-c', 'lock_timeout=30s', '-c', 'idle_in_transaction_session_timeout=30000']
  * requests_cpu:4
  * requests_memory:16Gi
  * eval_parameters
    * code:1782081126
    * TENANT_VOL:False
* PostgreSQL-1-1-2-1 uses docker image postgres:18.3
  * RAM:540492877824
  * CPU:Intel(R) Xeon(R) Gold 6430
  * Cores:128
  * host:6.8.0-111-generic
  * node:cl-worker38
  * disk:225919
  * cpu_list:0-127
  * args:['-c', 'max_connections=640', '-c', 'max_worker_processes=16', '-c', 'max_parallel_workers=16', '-c', 'max_parallel_workers_per_gather=8', '-c', 'max_parallel_maintenance_workers=4', '-c', 'shared_buffers=16GB', '-c', 'effective_cache_size=40GB', '-c', 'work_mem=512MB', '-c', 'maintenance_work_mem=2GB', '-c', 'autovacuum=off', '-c', 'wal_level=minimal', '-c', 'max_wal_senders=0', '-c', 'max_wal_size=32GB', '-c', 'checkpoint_timeout=1h', '-c', 'checkpoint_completion_target=1.0', '-c', 'lock_timeout=30s', '-c', 'idle_in_transaction_session_timeout=30000']
  * requests_cpu:4
  * requests_memory:16Gi
  * eval_parameters
    * code:1782081126
    * TENANT_VOL:False

### Workflow

#### Actual

* DBMS PostgreSQL-1 - Experiment 1 Client 1: benchbase (1 pods)
* DBMS PostgreSQL-1 - Experiment 1 Client 2: benchbase (2 pods)

#### Planned

* DBMS PostgreSQL-1 - Experiment 1 Client 1: benchbase (1 pods)
* DBMS PostgreSQL-1 - Experiment 1 Client 2: benchbase (2 pods)

### Loading

#### Per Run

|                |   experiment_run |   SF |   time_load |   time_preload |   time_generate |   time_ingest |   time_postload |   loading_pods |   terminals | tenant_id   | type_tenants   |   num_tenants | vol_tenants   |   Throughput [SF/h] |
|:---------------|-----------------:|-----:|------------:|---------------:|----------------:|--------------:|----------------:|---------------:|------------:|:------------|:---------------|--------------:|:--------------|--------------------:|
| PostgreSQL-1-1 |                1 | 1000 |       47.00 |           1.00 |            0.00 |          5.00 |           41.00 |              1 |           1 |             |                |             0 | False         |            76595.74 |

### Execution

#### Per Connection

| DBMS                 | phase            | job                |   experiment_run |   terminals |   target |   client |   benchmark_run |   child |   tenant_id |   time |   num_errors |   Throughput (requests/second) |   Goodput (requests/second) |   efficiency |   Latency Distribution.95th Percentile Latency (microseconds) |   Latency Distribution.Average Latency (microseconds) |
|:---------------------|:-----------------|:-------------------|-----------------:|------------:|---------:|---------:|----------------:|--------:|------------:|-------:|-------------:|-------------------------------:|----------------------------:|-------------:|--------------------------------------------------------------:|------------------------------------------------------:|
| PostgreSQL-1-1-1-1-1 | PostgreSQL-1-1-1 | PostgreSQL-1-1-1-1 |                1 |          32 |    16384 |        1 |               1 |       1 |           0 | 300.00 |            0 |                       16384.07 |                    16384.07 |         0.00 |                                                       1161.00 |                                                576.00 |
| PostgreSQL-1-1-2-1-1 | PostgreSQL-1-1-2 | PostgreSQL-1-1-2-1 |                1 |          16 |     8192 |        2 |               1 |       1 |           0 | 300.00 |            0 |                        8192.02 |                     8192.03 |         0.00 |                                                       1302.00 |                                                666.00 |
| PostgreSQL-1-1-2-1-2 | PostgreSQL-1-1-2 | PostgreSQL-1-1-2-1 |                1 |          16 |     8192 |        2 |               1 |       2 |           0 | 300.00 |            0 |                        8192.02 |                     8192.03 |         0.00 |                                                       1300.00 |                                                651.00 |

#### Per Phase

| DBMS             | phase            |   experiment_run |   terminals |   target |   benchmark_run |   pod_count |   tenant_id |   time |   num_errors |   Throughput (requests/second) |   Goodput (requests/second) |   efficiency |   Latency Distribution.95th Percentile Latency (microseconds) |   Latency Distribution.Average Latency (microseconds) |
|:-----------------|:-----------------|-----------------:|------------:|---------:|----------------:|------------:|------------:|-------:|-------------:|-------------------------------:|----------------------------:|-------------:|--------------------------------------------------------------:|------------------------------------------------------:|
| PostgreSQL-1-1-1 | PostgreSQL-1-1-1 |                1 |          32 |    16384 |               1 |           1 |           0 | 300.00 |            0 |                       16384.07 |                    16384.07 |         0.00 |                                                       1161.00 |                                                576.00 |
| PostgreSQL-1-1-2 | PostgreSQL-1-1-2 |                1 |          32 |    16384 |               1 |           2 |           0 | 300.00 |            0 |                       16384.05 |                    16384.06 |         0.00 |                                                       1302.00 |                                                658.50 |

### Tests
* TEST passed: Throughput (requests/second) contains no 0 or NaN
* TEST passed: Workflow as planned
YCSB Simple Testrun Workload B
For performing the experiment we can run the benchbase file.
Example:
bexhoma benchbase \
  -dbms PostgreSQL \
  -sf 1000 \
  -xbt ycsb \
  -xwl b \
  -xsd 5 \
  -xtb 1024 \
  -xnbf 16 \
  -nlt 64 \
  -nbp 1,2 \
  -nbt 32 \
  -tr \
  -rss 1000Gi \
  -rnn $BEXHOMA_NODE_SUT -rnl $BEXHOMA_NODE_LOAD -rnb $BEXHOMA_NODE_BENCHMARK \
  run &>$LOG_DIR/docs_benchbase_postgresql_ycsb_b.log
Evaluate Results
At the end of a benchmark you will see a summary like
docs_benchbase_postgresql_ycsb_b.log
## Show Summary

### Workload
Benchbase Workload ycsb SF=1000
* Type: benchbase
* Duration: 1053s
* Code: 1782082180
* Benchbase runs an YCSB experiment.
* This experiment compares run time and resource consumption of Benchbase queries in different DBMS.
  * Benchbase data is generated and loaded using several threads.
  * Benchmark is 'ycsb'. Workload is 'b'. Scaling factor is 1000. Target is based on multiples of '1024'. Factors for benchmarking are [16]. Benchmarking runs for 5 minutes.
  * Experiment uses bexhoma version 0.9.17.
  * Experiment is limited to DBMS ['PostgreSQL'].
  * Import is handled by 1 processes (pods).
  * Loading is fixed to cl-worker19.
  * Benchmarking is fixed to cl-worker19.
  * SUT is fixed to cl-worker38.
  * Loading is tested with [64] threads, split into [1] pods.
  * Benchmarking is tested with [32] threads, split into [1, 2] pods.
  * Benchmarking is run as [1] times the number of benchmarking pods.
  * Experiment is run once.

### Connections
* PostgreSQL-1-1-1-1 uses docker image postgres:18.3
  * RAM:540492877824
  * CPU:Intel(R) Xeon(R) Gold 6430
  * Cores:128
  * host:6.8.0-111-generic
  * node:cl-worker38
  * disk:222216
  * cpu_list:0-127
  * args:['-c', 'max_connections=640', '-c', 'max_worker_processes=16', '-c', 'max_parallel_workers=16', '-c', 'max_parallel_workers_per_gather=8', '-c', 'max_parallel_maintenance_workers=4', '-c', 'shared_buffers=16GB', '-c', 'effective_cache_size=40GB', '-c', 'work_mem=512MB', '-c', 'maintenance_work_mem=2GB', '-c', 'autovacuum=off', '-c', 'wal_level=minimal', '-c', 'max_wal_senders=0', '-c', 'max_wal_size=32GB', '-c', 'checkpoint_timeout=1h', '-c', 'checkpoint_completion_target=1.0', '-c', 'lock_timeout=30s', '-c', 'idle_in_transaction_session_timeout=30000']
  * requests_cpu:4
  * requests_memory:16Gi
  * eval_parameters
    * code:1782082180
    * TENANT_VOL:False
* PostgreSQL-1-1-2-1 uses docker image postgres:18.3
  * RAM:540492877824
  * CPU:Intel(R) Xeon(R) Gold 6430
  * Cores:128
  * host:6.8.0-111-generic
  * node:cl-worker38
  * disk:222633
  * cpu_list:0-127
  * args:['-c', 'max_connections=640', '-c', 'max_worker_processes=16', '-c', 'max_parallel_workers=16', '-c', 'max_parallel_workers_per_gather=8', '-c', 'max_parallel_maintenance_workers=4', '-c', 'shared_buffers=16GB', '-c', 'effective_cache_size=40GB', '-c', 'work_mem=512MB', '-c', 'maintenance_work_mem=2GB', '-c', 'autovacuum=off', '-c', 'wal_level=minimal', '-c', 'max_wal_senders=0', '-c', 'max_wal_size=32GB', '-c', 'checkpoint_timeout=1h', '-c', 'checkpoint_completion_target=1.0', '-c', 'lock_timeout=30s', '-c', 'idle_in_transaction_session_timeout=30000']
  * requests_cpu:4
  * requests_memory:16Gi
  * eval_parameters
    * code:1782082180
    * TENANT_VOL:False

### Workflow

#### Actual

* DBMS PostgreSQL-1 - Experiment 1 Client 1: benchbase (1 pods)
* DBMS PostgreSQL-1 - Experiment 1 Client 2: benchbase (2 pods)

#### Planned

* DBMS PostgreSQL-1 - Experiment 1 Client 1: benchbase (1 pods)
* DBMS PostgreSQL-1 - Experiment 1 Client 2: benchbase (2 pods)

### Loading

#### Per Run

|                |   experiment_run |   SF |   time_load |   time_preload |   time_generate |   time_ingest |   time_postload |   loading_pods |   terminals | tenant_id   | type_tenants   |   num_tenants | vol_tenants   |   Throughput [SF/h] |
|:---------------|-----------------:|-----:|------------:|---------------:|----------------:|--------------:|----------------:|---------------:|------------:|:------------|:---------------|--------------:|:--------------|--------------------:|
| PostgreSQL-1-1 |                1 | 1000 |       51.00 |           1.00 |            0.00 |          8.00 |           42.00 |              1 |           1 |             |                |             0 | False         |            70588.24 |

### Execution

#### Per Connection

| DBMS                 | phase            | job                |   experiment_run |   terminals |   target |   client |   benchmark_run |   child |   tenant_id |   time |   num_errors |   Throughput (requests/second) |   Goodput (requests/second) |   efficiency |   Latency Distribution.95th Percentile Latency (microseconds) |   Latency Distribution.Average Latency (microseconds) |
|:---------------------|:-----------------|:-------------------|-----------------:|------------:|---------:|---------:|----------------:|--------:|------------:|-------:|-------------:|-------------------------------:|----------------------------:|-------------:|--------------------------------------------------------------:|------------------------------------------------------:|
| PostgreSQL-1-1-1-1-1 | PostgreSQL-1-1-1 | PostgreSQL-1-1-1-1 |                1 |          32 |    16384 |        1 |               1 |       1 |           0 | 300.00 |            0 |                       16384.04 |                    16384.06 |         0.00 |                                                       1071.00 |                                                478.00 |
| PostgreSQL-1-1-2-1-1 | PostgreSQL-1-1-2 | PostgreSQL-1-1-2-1 |                1 |          16 |     8192 |        2 |               1 |       1 |           0 | 300.00 |            0 |                        8192.02 |                     8192.03 |         0.00 |                                                       1012.00 |                                                448.00 |
| PostgreSQL-1-1-2-1-2 | PostgreSQL-1-1-2 | PostgreSQL-1-1-2-1 |                1 |          16 |     8192 |        2 |               1 |       2 |           0 | 300.00 |            0 |                        8192.03 |                     8192.03 |         0.00 |                                                       1090.00 |                                                474.00 |

#### Per Phase

| DBMS             | phase            |   experiment_run |   terminals |   target |   benchmark_run |   pod_count |   tenant_id |   time |   num_errors |   Throughput (requests/second) |   Goodput (requests/second) |   efficiency |   Latency Distribution.95th Percentile Latency (microseconds) |   Latency Distribution.Average Latency (microseconds) |
|:-----------------|:-----------------|-----------------:|------------:|---------:|----------------:|------------:|------------:|-------:|-------------:|-------------------------------:|----------------------------:|-------------:|--------------------------------------------------------------:|------------------------------------------------------:|
| PostgreSQL-1-1-1 | PostgreSQL-1-1-1 |                1 |          32 |    16384 |               1 |           1 |           0 | 300.00 |            0 |                       16384.04 |                    16384.06 |         0.00 |                                                       1071.00 |                                                478.00 |
| PostgreSQL-1-1-2 | PostgreSQL-1-1-2 |                1 |          32 |    16384 |               1 |           2 |           0 | 300.00 |            0 |                       16384.05 |                    16384.06 |         0.00 |                                                       1090.00 |                                                461.00 |

### Tests
* TEST passed: Throughput (requests/second) contains no 0 or NaN
* TEST passed: Workflow as planned
YCSB Simple Testrun Workload D
For performing the experiment we can run the benchbase file.
Example:
bexhoma benchbase \
  -dbms PostgreSQL \
  -sf 1000 \
  -xbt ycsb \
  -xwl d \
  -xsd 5 \
  -xtb 1024 \
  -xnbf 16 \
  -nlt 64 \
  -nbp 1 \
  -nbt 32 \
  -tr \
  -rss 1000Gi \
  -rnn $BEXHOMA_NODE_SUT -rnl $BEXHOMA_NODE_LOAD -rnb $BEXHOMA_NODE_BENCHMARK \
  run &>$LOG_DIR/docs_benchbase_postgresql_ycsb_d.log
This time we only use a single benchmarking pod. This is because the workload contains INSERTs and two parallel pods would try to insert the same data. Other than the original YCSB tool, Benchbase does not offer an option to limit the range of keys to be inserted.
Evaluate Results
At the end of a benchmark you will see a summary like
docs_benchbase_postgresql_ycsb_d.log
## Show Summary

### Workload
Benchbase Workload ycsb SF=1000
* Type: benchbase
* Duration: 645s
* Code: 1782083239
* Benchbase runs an YCSB experiment.
* This experiment compares run time and resource consumption of Benchbase queries in different DBMS.
  * Benchbase data is generated and loaded using several threads.
  * Benchmark is 'ycsb'. Workload is 'd'. Scaling factor is 1000. Target is based on multiples of '1024'. Factors for benchmarking are [16]. Benchmarking runs for 5 minutes.
  * Experiment uses bexhoma version 0.9.17.
  * Experiment is limited to DBMS ['PostgreSQL'].
  * Import is handled by 1 processes (pods).
  * Loading is fixed to cl-worker19.
  * Benchmarking is fixed to cl-worker19.
  * SUT is fixed to cl-worker38.
  * Loading is tested with [64] threads, split into [1] pods.
  * Benchmarking is tested with [32] threads, split into [1] pods.
  * Benchmarking is run as [1] times the number of benchmarking pods.
  * Experiment is run once.

### Connections
* PostgreSQL-1-1-1-1 uses docker image postgres:18.3
  * RAM:540492877824
  * CPU:Intel(R) Xeon(R) Gold 6430
  * Cores:128
  * host:6.8.0-111-generic
  * node:cl-worker38
  * disk:222216
  * cpu_list:0-127
  * args:['-c', 'max_connections=640', '-c', 'max_worker_processes=16', '-c', 'max_parallel_workers=16', '-c', 'max_parallel_workers_per_gather=8', '-c', 'max_parallel_maintenance_workers=4', '-c', 'shared_buffers=16GB', '-c', 'effective_cache_size=40GB', '-c', 'work_mem=512MB', '-c', 'maintenance_work_mem=2GB', '-c', 'autovacuum=off', '-c', 'wal_level=minimal', '-c', 'max_wal_senders=0', '-c', 'max_wal_size=32GB', '-c', 'checkpoint_timeout=1h', '-c', 'checkpoint_completion_target=1.0', '-c', 'lock_timeout=30s', '-c', 'idle_in_transaction_session_timeout=30000']
  * requests_cpu:4
  * requests_memory:16Gi
  * eval_parameters
    * code:1782083239
    * TENANT_VOL:False

### Workflow

#### Actual

* DBMS PostgreSQL-1 - Experiment 1 Client 1: benchbase (1 pods)

#### Planned

* DBMS PostgreSQL-1 - Experiment 1 Client 1: benchbase (1 pods)

### Loading

#### Per Run

|                |   experiment_run |   SF |   time_load |   time_preload |   time_generate |   time_ingest |   time_postload |   loading_pods |   terminals | tenant_id   | type_tenants   |   num_tenants | vol_tenants   |   Throughput [SF/h] |
|:---------------|-----------------:|-----:|------------:|---------------:|----------------:|--------------:|----------------:|---------------:|------------:|:------------|:---------------|--------------:|:--------------|--------------------:|
| PostgreSQL-1-1 |                1 | 1000 |       48.00 |           1.00 |            0.00 |          6.00 |           41.00 |              1 |           1 |             |                |             0 | False         |            75000.00 |

### Execution

#### Per Connection

| DBMS                 | phase            | job                |   experiment_run |   terminals |   target |   client |   benchmark_run |   child |   tenant_id |   time |   num_errors |   Throughput (requests/second) |   Goodput (requests/second) |   efficiency |   Latency Distribution.95th Percentile Latency (microseconds) |   Latency Distribution.Average Latency (microseconds) |
|:---------------------|:-----------------|:-------------------|-----------------:|------------:|---------:|---------:|----------------:|--------:|------------:|-------:|-------------:|-------------------------------:|----------------------------:|-------------:|--------------------------------------------------------------:|------------------------------------------------------:|
| PostgreSQL-1-1-1-1-1 | PostgreSQL-1-1-1 | PostgreSQL-1-1-1-1 |                1 |          32 |    16384 |        1 |               1 |       1 |           0 | 300.00 |            0 |                       16384.05 |                    16384.07 |         0.00 |                                                       1089.00 |                                                495.00 |

#### Per Phase

| DBMS             | phase            |   experiment_run |   terminals |   target |   benchmark_run |   pod_count |   tenant_id |   time |   num_errors |   Throughput (requests/second) |   Goodput (requests/second) |   efficiency |   Latency Distribution.95th Percentile Latency (microseconds) |   Latency Distribution.Average Latency (microseconds) |
|:-----------------|:-----------------|-----------------:|------------:|---------:|----------------:|------------:|------------:|-------:|-------------:|-------------------------------:|----------------------------:|-------------:|--------------------------------------------------------------:|------------------------------------------------------:|
| PostgreSQL-1-1-1 | PostgreSQL-1-1-1 |                1 |          32 |    16384 |               1 |           1 |           0 | 300.00 |            0 |                       16384.05 |                    16384.07 |         0.00 |                                                       1089.00 |                                                495.00 |

### Tests
* TEST passed: Throughput (requests/second) contains no 0 or NaN
* TEST passed: Workflow as planned
YCSB Simple Testrun Workload E
For performing the experiment we can run the benchbase file.
Example:
bexhoma benchbase \
  -dbms PostgreSQL \
  -sf 1000 \
  -xbt ycsb \
  -xwl e \
  -xsd 5 \
  -xtb 1024 \
  -xnbf 16 \
  -nlt 64 \
  -nbp 1 \
  -nbt 32 \
  -tr \
  -rss 1000Gi \
  -rnn $BEXHOMA_NODE_SUT -rnl $BEXHOMA_NODE_LOAD -rnb $BEXHOMA_NODE_BENCHMARK \
  run &>$LOG_DIR/docs_benchbase_postgresql_ycsb_e.log
This time we only use a single benchmarking pod. This is because the workload contains INSERTs and two parallel pods would try to insert the same data. Other than the original YCSB tool, Benchbase does not offer an option to limit the range of keys to be inserted.
Evaluate Results
At the end of a benchmark you will see a summary like
docs_benchbase_postgresql_ycsb_e.log
## Show Summary

### Workload
Benchbase Workload ycsb SF=1000
* Type: benchbase
* Duration: 611s
* Code: 1782083890
* Benchbase runs an YCSB experiment.
* This experiment compares run time and resource consumption of Benchbase queries in different DBMS.
  * Benchbase data is generated and loaded using several threads.
  * Benchmark is 'ycsb'. Workload is 'e'. Scaling factor is 1000. Target is based on multiples of '1024'. Factors for benchmarking are [16]. Benchmarking runs for 5 minutes.
  * Experiment uses bexhoma version 0.9.17.
  * Experiment is limited to DBMS ['PostgreSQL'].
  * Import is handled by 1 processes (pods).
  * Loading is fixed to cl-worker19.
  * Benchmarking is fixed to cl-worker19.
  * SUT is fixed to cl-worker38.
  * Loading is tested with [64] threads, split into [1] pods.
  * Benchmarking is tested with [32] threads, split into [1] pods.
  * Benchmarking is run as [1] times the number of benchmarking pods.
  * Experiment is run once.

### Connections
* PostgreSQL-1-1-1-1 uses docker image postgres:18.3
  * RAM:540492877824
  * CPU:Intel(R) Xeon(R) Gold 6430
  * Cores:128
  * host:6.8.0-111-generic
  * node:cl-worker38
  * disk:222216
  * cpu_list:0-127
  * args:['-c', 'max_connections=640', '-c', 'max_worker_processes=16', '-c', 'max_parallel_workers=16', '-c', 'max_parallel_workers_per_gather=8', '-c', 'max_parallel_maintenance_workers=4', '-c', 'shared_buffers=16GB', '-c', 'effective_cache_size=40GB', '-c', 'work_mem=512MB', '-c', 'maintenance_work_mem=2GB', '-c', 'autovacuum=off', '-c', 'wal_level=minimal', '-c', 'max_wal_senders=0', '-c', 'max_wal_size=32GB', '-c', 'checkpoint_timeout=1h', '-c', 'checkpoint_completion_target=1.0', '-c', 'lock_timeout=30s', '-c', 'idle_in_transaction_session_timeout=30000']
  * requests_cpu:4
  * requests_memory:16Gi
  * eval_parameters
    * code:1782083890
    * TENANT_VOL:False

### Workflow

#### Actual

* DBMS PostgreSQL-1 - Experiment 1 Client 1: benchbase (1 pods)

#### Planned

* DBMS PostgreSQL-1 - Experiment 1 Client 1: benchbase (1 pods)

### Loading

#### Per Run

|                |   experiment_run |   SF |   time_load |   time_preload |   time_generate |   time_ingest |   time_postload |   loading_pods |   terminals | tenant_id   | type_tenants   |   num_tenants | vol_tenants   |   Throughput [SF/h] |
|:---------------|-----------------:|-----:|------------:|---------------:|----------------:|--------------:|----------------:|---------------:|------------:|:------------|:---------------|--------------:|:--------------|--------------------:|
| PostgreSQL-1-1 |                1 | 1000 |       48.00 |           0.00 |            0.00 |          7.00 |           41.00 |              1 |           1 |             |                |             0 | False         |            75000.00 |

### Execution

#### Per Connection

| DBMS                 | phase            | job                |   experiment_run |   terminals |   target |   client |   benchmark_run |   child |   tenant_id |   time |   num_errors |   Throughput (requests/second) |   Goodput (requests/second) |   efficiency |   Latency Distribution.95th Percentile Latency (microseconds) |   Latency Distribution.Average Latency (microseconds) |
|:---------------------|:-----------------|:-------------------|-----------------:|------------:|---------:|---------:|----------------:|--------:|------------:|-------:|-------------:|-------------------------------:|----------------------------:|-------------:|--------------------------------------------------------------:|------------------------------------------------------:|
| PostgreSQL-1-1-1-1-1 | PostgreSQL-1-1-1 | PostgreSQL-1-1-1-1 |                1 |          32 |    16384 |        1 |               1 |       1 |           0 | 300.00 |            0 |                        3733.77 |                     3733.88 |         0.00 |                                                      19672.00 |                                               8557.00 |

#### Per Phase

| DBMS             | phase            |   experiment_run |   terminals |   target |   benchmark_run |   pod_count |   tenant_id |   time |   num_errors |   Throughput (requests/second) |   Goodput (requests/second) |   efficiency |   Latency Distribution.95th Percentile Latency (microseconds) |   Latency Distribution.Average Latency (microseconds) |
|:-----------------|:-----------------|-----------------:|------------:|---------:|----------------:|------------:|------------:|-------:|-------------:|-------------------------------:|----------------------------:|-------------:|--------------------------------------------------------------:|------------------------------------------------------:|
| PostgreSQL-1-1-1 | PostgreSQL-1-1-1 |                1 |          32 |    16384 |               1 |           1 |           0 | 300.00 |            0 |                        3733.77 |                     3733.88 |         0.00 |                                                      19672.00 |                                               8557.00 |

### Tests
* TEST passed: Throughput (requests/second) contains no 0 or NaN
* TEST passed: Workflow as planned
YCSB Simple Testrun Workload F
For performing the experiment we can run the benchbase file.
Example:
bexhoma benchbase \
  -dbms PostgreSQL \
  -sf 1000 \
  -xbt ycsb \
  -xwl f \
  -xsd 5 \
  -xtb 1024 \
  -xnbf 16 \
  -nlt 64 \
  -nbp 1,2 \
  -nbt 32 \
  -tr \
  -rss 1000Gi \
  -rnn $BEXHOMA_NODE_SUT -rnl $BEXHOMA_NODE_LOAD -rnb $BEXHOMA_NODE_BENCHMARK \
  run &>$LOG_DIR/docs_benchbase_postgresql_ycsb_f.log
Evaluate Results
At the end of a benchmark you will see a summary like
docs_benchbase_postgresql_ycsb_f.log
## Show Summary

### Workload
Benchbase Workload ycsb SF=1000
* Type: benchbase
* Duration: 1019s
* Code: 1782084508
* Benchbase runs an YCSB experiment.
* This experiment compares run time and resource consumption of Benchbase queries in different DBMS.
  * Benchbase data is generated and loaded using several threads.
  * Benchmark is 'ycsb'. Workload is 'f'. Scaling factor is 1000. Target is based on multiples of '1024'. Factors for benchmarking are [16]. Benchmarking runs for 5 minutes.
  * Experiment uses bexhoma version 0.9.17.
  * Experiment is limited to DBMS ['PostgreSQL'].
  * Import is handled by 1 processes (pods).
  * Loading is fixed to cl-worker19.
  * Benchmarking is fixed to cl-worker19.
  * SUT is fixed to cl-worker38.
  * Loading is tested with [64] threads, split into [1] pods.
  * Benchmarking is tested with [32] threads, split into [1, 2] pods.
  * Benchmarking is run as [1] times the number of benchmarking pods.
  * Experiment is run once.

### Connections
* PostgreSQL-1-1-1-1 uses docker image postgres:18.3
  * RAM:540492877824
  * CPU:Intel(R) Xeon(R) Gold 6430
  * Cores:128
  * host:6.8.0-111-generic
  * node:cl-worker38
  * disk:222217
  * cpu_list:0-127
  * args:['-c', 'max_connections=640', '-c', 'max_worker_processes=16', '-c', 'max_parallel_workers=16', '-c', 'max_parallel_workers_per_gather=8', '-c', 'max_parallel_maintenance_workers=4', '-c', 'shared_buffers=16GB', '-c', 'effective_cache_size=40GB', '-c', 'work_mem=512MB', '-c', 'maintenance_work_mem=2GB', '-c', 'autovacuum=off', '-c', 'wal_level=minimal', '-c', 'max_wal_senders=0', '-c', 'max_wal_size=32GB', '-c', 'checkpoint_timeout=1h', '-c', 'checkpoint_completion_target=1.0', '-c', 'lock_timeout=30s', '-c', 'idle_in_transaction_session_timeout=30000']
  * requests_cpu:4
  * requests_memory:16Gi
  * eval_parameters
    * code:1782084508
    * TENANT_VOL:False
* PostgreSQL-1-1-2-1 uses docker image postgres:18.3
  * RAM:540492877824
  * CPU:Intel(R) Xeon(R) Gold 6430
  * Cores:128
  * host:6.8.0-111-generic
  * node:cl-worker38
  * disk:226057
  * cpu_list:0-127
  * args:['-c', 'max_connections=640', '-c', 'max_worker_processes=16', '-c', 'max_parallel_workers=16', '-c', 'max_parallel_workers_per_gather=8', '-c', 'max_parallel_maintenance_workers=4', '-c', 'shared_buffers=16GB', '-c', 'effective_cache_size=40GB', '-c', 'work_mem=512MB', '-c', 'maintenance_work_mem=2GB', '-c', 'autovacuum=off', '-c', 'wal_level=minimal', '-c', 'max_wal_senders=0', '-c', 'max_wal_size=32GB', '-c', 'checkpoint_timeout=1h', '-c', 'checkpoint_completion_target=1.0', '-c', 'lock_timeout=30s', '-c', 'idle_in_transaction_session_timeout=30000']
  * requests_cpu:4
  * requests_memory:16Gi
  * eval_parameters
    * code:1782084508
    * TENANT_VOL:False

### Workflow

#### Actual

* DBMS PostgreSQL-1 - Experiment 1 Client 1: benchbase (1 pods)
* DBMS PostgreSQL-1 - Experiment 1 Client 2: benchbase (2 pods)

#### Planned

* DBMS PostgreSQL-1 - Experiment 1 Client 1: benchbase (1 pods)
* DBMS PostgreSQL-1 - Experiment 1 Client 2: benchbase (2 pods)

### Loading

#### Per Run

|                |   experiment_run |   SF |   time_load |   time_preload |   time_generate |   time_ingest |   time_postload |   loading_pods |   terminals | tenant_id   | type_tenants   |   num_tenants | vol_tenants   |   Throughput [SF/h] |
|:---------------|-----------------:|-----:|------------:|---------------:|----------------:|--------------:|----------------:|---------------:|------------:|:------------|:---------------|--------------:|:--------------|--------------------:|
| PostgreSQL-1-1 |                1 | 1000 |       50.00 |           1.00 |            0.00 |          8.00 |           41.00 |              1 |           1 |             |                |             0 | False         |            72000.00 |

### Execution

#### Per Connection

| DBMS                 | phase            | job                |   experiment_run |   terminals |   target |   client |   benchmark_run |   child |   tenant_id |   time |   num_errors |   Throughput (requests/second) |   Goodput (requests/second) |   efficiency |   Latency Distribution.95th Percentile Latency (microseconds) |   Latency Distribution.Average Latency (microseconds) |
|:---------------------|:-----------------|:-------------------|-----------------:|------------:|---------:|---------:|----------------:|--------:|------------:|-------:|-------------:|-------------------------------:|----------------------------:|-------------:|--------------------------------------------------------------:|------------------------------------------------------:|
| PostgreSQL-1-1-1-1-1 | PostgreSQL-1-1-1 | PostgreSQL-1-1-1-1 |                1 |          32 |    16384 |        1 |               1 |       1 |           0 | 300.00 |            0 |                       16384.04 |                    16384.07 |         0.00 |                                                       1638.00 |                                                704.00 |
| PostgreSQL-1-1-2-1-1 | PostgreSQL-1-1-2 | PostgreSQL-1-1-2-1 |                1 |          16 |     8192 |        2 |               1 |       1 |           0 | 300.00 |            0 |                        8192.01 |                     8192.03 |         0.00 |                                                       1693.00 |                                                733.00 |
| PostgreSQL-1-1-2-1-2 | PostgreSQL-1-1-2 | PostgreSQL-1-1-2-1 |                1 |          16 |     8192 |        2 |               1 |       2 |           0 | 300.00 |            0 |                        8192.02 |                     8192.03 |         0.00 |                                                       1663.00 |                                                711.00 |

#### Per Phase

| DBMS             | phase            |   experiment_run |   terminals |   target |   benchmark_run |   pod_count |   tenant_id |   time |   num_errors |   Throughput (requests/second) |   Goodput (requests/second) |   efficiency |   Latency Distribution.95th Percentile Latency (microseconds) |   Latency Distribution.Average Latency (microseconds) |
|:-----------------|:-----------------|-----------------:|------------:|---------:|----------------:|------------:|------------:|-------:|-------------:|-------------------------------:|----------------------------:|-------------:|--------------------------------------------------------------:|------------------------------------------------------:|
| PostgreSQL-1-1-1 | PostgreSQL-1-1-1 |                1 |          32 |    16384 |               1 |           1 |           0 | 300.00 |            0 |                       16384.04 |                    16384.07 |         0.00 |                                                       1638.00 |                                                704.00 |
| PostgreSQL-1-1-2 | PostgreSQL-1-1-2 |                1 |          32 |    16384 |               1 |           2 |           0 | 300.00 |            0 |                       16384.03 |                    16384.06 |         0.00 |                                                       1693.00 |                                                722.00 |

### Tests
* TEST passed: Throughput (requests/second) contains no 0 or NaN
* TEST passed: Workflow as planned