Benchmark: TPC-DS
TPC-DS does allow scaling data generation and ingestion, and scaling the benchmarking driver. Scale-out can simulate distributed clients for the loading test and the throughput test [2].
This example shows how to benchmark 99 reading queries Q1-Q99 derived from TPC-DS in PostgreSQL.
The query file is derived from the TPC-DS and as such is not comparable to published TPC-DS results, as the query file results do not comply with the TPC-DS Specification.
In particular we had to apply changes to the queries, because
MySQL and MariaDB do not have a FULL OUTER JOIN (Q51, Q97, …)
MySQL and MariaDB do CASTing to INTEGER differently
column names may differ if AS is not used
MariaDB does not know GROUPING
the DBMS do not sort in the same way when NULL comes into play
See query file for all details.
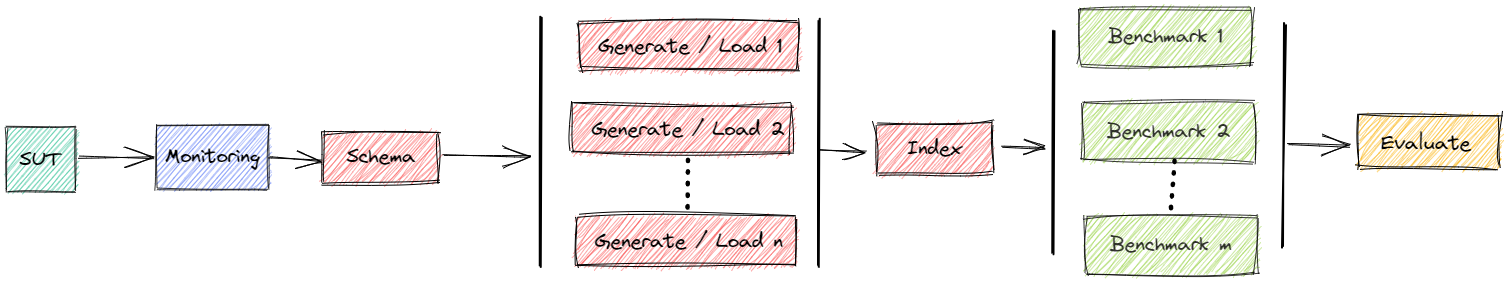
The schema of
MonetDB: sets primary keys and foreign key constraints after import and no other indexes
MySQL: sets primary keys before import, all foreign key constraints and indexes on foreign keys of fact tables and customer table after import
MariaDB: sets primary keys before import, all foreign key constraints and indexes on foreign keys of fact tables and customer table after import
PostgreSQL: sets primary keys before import, all foreign key constraints and indexes on foreign keys of fact tables and customer table after import
MySQL is excluded currently because the treatment of NULL during INSERT is complicated.
The results are not official benchmark results. Exact performance depends on a number of parameters. You may get different results. These examples are solely to illustrate how to use bexhoma and show the result evaluation.
For a comparison of multiple DBMS (PostgreSQL, MonetDB, MySQL, MariaDB) see TestCases.md.
Official TPC-DS benchmark - http://www.tpc.org/tpcds
A Cloud-Native Adoption of Classical DBMS Performance Benchmarks and Tools: https://doi.org/10.1007/978-3-031-68031-1_9
Perform Benchmark - Power Test
You will have to change the node selectors there (to names of nodes, that exist in your cluster - or to leave out the corresponding parameters):
BEXHOMA_NODE_SUT="cl-worker11"
BEXHOMA_NODE_LOAD="cl-worker19"
BEXHOMA_NODE_BENCHMARK="cl-worker19"
LOG_DIR="./logs_tests"
BEXHOMA_MS=1
BEXHOMA_STORAGE_CLASS="shared"

mkdir -p $LOG_DIR
For performing the experiment we can run the tpcds file.
Example:
bexhoma tpcds \
  -dbms PostgreSQL \
  -sf 1 \
  -nlp 8 \
  -nlt 8 \
  -xii -xic -xis \
  -xdt \
  -ms $BEXHOMA_MS \
  -t 1200 \
  -tr \
  -lr 64Gi \
  -rr 64Gi \
  -rss 50Gi \
  -rnn $BEXHOMA_NODE_SUT -rnl $BEXHOMA_NODE_LOAD -rnb $BEXHOMA_NODE_BENCHMARK \
  run &>$LOG_DIR/docs_tpcds_postgresql.log
This
starts a clean instance of PostgreSQL
fixed 64 Gi RAM (request
-rrand limit-lr)data directory inside a Docker container
creates TPC-DS schema in the database
starts 8 loader pods (
-nlp)with a data generator (init) container each
generating a portion of TPC-DS data of scaling factor 1 (
-sf)storing the data in a distributed filesystem (shared disk)
if data is already present: do nothing
with a loading container each
importing TPC-DS data from the distributed filesystem
loading uses 8 threads (
-nlt)
creates constraints (
-xic) and indexes (-xii) and updates table statistics (-xis) after ingestionruns 1 stream of TPC-DS queries
data transfer is also measured (
-xdt)
shows a summary
Status
You can watch the status while benchmark is running via bexhoma status
Dashboard: Running
Cluster Prometheus: Running
Message Queue: Running
Data directory: Running
Result directory: Running
+------------------+--------------+--------------+---------------+
| 1706255897       | sut          |   loaded [s] | loading       |
+==================+==============+==============+===============+
| MonetDB-BHT-8    | (1. Running) |       253.23 |               |
+------------------+--------------+--------------+---------------+
| MySQL-BHT-8-8    | (1. Running) |         0.61 | (8 Succeeded) |
+------------------+--------------+--------------+---------------+
| PostgreSQL-BHT-8 | (1. Running) |       219.08 |               |
+------------------+--------------+--------------+---------------+
The code 1706255897 is the unique identifier of the experiment.
You can find the number also in the output of tpcds.py.
Cleanup
The script is supposed to clean up and remove everything from the cluster that is related to the experiment after finishing.
If something goes wrong, you can also clean up manually with bexperiment stop (removes everything) or bexperiment stop -e 1706255897 (removes everything that is related to experiment 1706255897).
Evaluate Results
At the end of a benchmark you will see a summary like
docs_tpcds_postgresql.log
## Show Summary

### Workload
TPC-DS Queries SF=1
* Type: tpcds
* Duration: 585s
* Code: 1783001511
* This includes the reading queries of TPC-DS.
* This experiment compares run time and resource consumption of TPC-DS queries in different DBMS.
  * TPC-DS (SF=1) data is loaded and benchmark is executed.
  * Query ordering is Q1 - Q99.
  * All instances use the same query parameters.
  * Timeout per query is 1200.
  * Import sets indexes and constraints after loading and recomputes statistics.
  * Experiment uses bexhoma version 0.10.2.
  * Experiment is limited to DBMS ['PostgreSQL'].
  * Import is handled by 8 processes (pods).
  * Loading is fixed to cl-worker19.
  * Benchmarking is fixed to cl-worker19.
  * Database uses ephemeral storage of size 15Gi.
  * Loading is tested with [8] threads, split into [8] pods.
  * Benchmarking is tested with [1] threads, split into [1] pods.
  * Benchmarking is run as [1] times the number of benchmarking pods.
  * Experiment is run once.

### Connections
* PostgreSQL-1-1-1-1-1 uses docker image postgres:18.3
  * RAM:2164173246464
  * CPU:INTEL(R) XEON(R) PLATINUM 8570
  * Cores:224
  * host:6.8.0-111-generic
  * node:cl-worker36
  * disk:649421
  * cpu_list:0-223
  * args:['-c', 'max_connections=640', '-c', 'max_worker_processes=16', '-c', 'max_parallel_workers=16', '-c', 'max_parallel_workers_per_gather=8', '-c', 'max_parallel_maintenance_workers=4', '-c', 'shared_buffers=16GB', '-c', 'effective_cache_size=40GB', '-c', 'work_mem=512MB', '-c', 'maintenance_work_mem=2GB', '-c', 'autovacuum=off', '-c', 'wal_level=minimal', '-c', 'max_wal_senders=0', '-c', 'max_wal_size=32GB', '-c', 'checkpoint_timeout=1h', '-c', 'checkpoint_completion_target=1.0', '-c', 'lock_timeout=30s', '-c', 'idle_in_transaction_session_timeout=30000']
  * requests_cpu:4
  * requests_memory:64Gi
  * limits_memory:64Gi
  * eval_parameters
    * code:1783001511

### SUT Container Restarts
* bexhoma-sut-postgresql-1-1783001511-574656c78d-6qxs6: 0 0

### Workflow

#### Actual

* DBMS PostgreSQL-1 - Experiment 1 Client 1: tpcds (1 pods)

#### Planned

* DBMS PostgreSQL-1 - Experiment 1 Client 1: tpcds (1 pods)

### Loading

#### Per Run

|                |   experiment_run |   SF |   time_load |   time_preload |   time_generate |   time_ingest |   time_postload |   loading_pods |   terminals | tenant_id   | type_tenants   |   num_tenants | vol_tenants   |   Throughput [SF/h] |
|:---------------|-----------------:|-----:|------------:|---------------:|----------------:|--------------:|----------------:|---------------:|------------:|:------------|:---------------|--------------:|:--------------|--------------------:|
| PostgreSQL-1-1 |                1 | 1.00 |      231.00 |           1.00 |            0.00 |         45.00 |          174.00 |              8 |           0 |             | None           |             0 | False         |               15.58 |

### Execution

#### Per Connection

|                      | configuration   | phase            | job                |   experiment_run |   client |   benchmark_run |   pod_count |   SF |   num_of_queries |   time [s] |   Geo Times [s] |   Power@Size [~Q/h] |   Throughput@Size |   tenant_id | pod                  |
|:---------------------|:----------------|:-----------------|:-------------------|-----------------:|---------:|----------------:|------------:|-----:|-----------------:|-----------:|----------------:|--------------------:|------------------:|------------:|:---------------------|
| PostgreSQL-1-1-1-1-1 | PostgreSQL-1    | PostgreSQL-1-1-1 | PostgreSQL-1-1-1-1 |                1 |        1 |               1 |           1 | 1.00 |               99 |        155 |            0.28 |            13413.08 |           2299.35 |          -1 | PostgreSQL-1-1-1-1-1 |

#### Per Phase

|                  | phase            |   experiment_run |   client |   benchmark_run |   pod_count |   SF |   num_of_queries |   time [s] |   Geo Times [s] |   Power@Size [~Q/h] |   Throughput@Size |   tenant_id |
|:-----------------|:-----------------|-----------------:|---------:|----------------:|------------:|-----:|-----------------:|-----------:|----------------:|--------------------:|------------------:|------------:|
| PostgreSQL-1-1-1 | PostgreSQL-1-1-1 |                1 |        1 |               1 |           1 | 1.00 |               99 |        155 |            0.28 |            13413.08 |           2299.35 |          -1 |

### Latency of Timer Execution [ms]
| Queries       |   PostgreSQL-1-1-1-1-1 |
|:--------------|-----------------------:|
| TPC-DS Q1     |                  90.44 |
| TPC-DS Q2     |                 195.45 |
| TPC-DS Q3     |                 123.13 |
| TPC-DS Q4     |                6401.93 |
| TPC-DS Q5     |                 370.14 |
| TPC-DS Q6     |               50352.66 |
| TPC-DS Q7     |                 288.01 |
| TPC-DS Q8     |                  48.59 |
| TPC-DS Q9     |                1768.99 |
| TPC-DS Q10    |                 853.76 |
| TPC-DS Q11    |                4023.67 |
| TPC-DS Q12    |                  54.89 |
| TPC-DS Q13    |                 462.85 |
| TPC-DS Q14a+b |                1528.23 |
| TPC-DS Q15    |                  99.73 |
| TPC-DS Q16    |                 156.68 |
| TPC-DS Q17    |                 255.73 |
| TPC-DS Q18    |                 332.06 |
| TPC-DS Q19    |                 126.95 |
| TPC-DS Q20    |                  83.09 |
| TPC-DS Q21    |                 166.65 |
| TPC-DS Q22    |                2736.20 |
| TPC-DS Q23a+b |                4093.47 |
| TPC-DS Q24a+b |                 467.75 |
| TPC-DS Q25    |                 259.24 |
| TPC-DS Q26    |                 191.22 |
| TPC-DS Q27    |                  16.82 |
| TPC-DS Q28    |                 556.03 |
| TPC-DS Q29    |                 267.33 |
| TPC-DS Q30    |                7568.85 |
| TPC-DS Q31    |                1288.15 |
| TPC-DS Q32    |                  76.91 |
| TPC-DS Q33    |                 279.98 |
| TPC-DS Q34    |                  16.74 |
| TPC-DS Q35    |                 978.94 |
| TPC-DS Q36    |                  17.66 |
| TPC-DS Q37    |                 219.55 |
| TPC-DS Q38    |                1041.99 |
| TPC-DS Q39a+b |                1916.40 |
| TPC-DS Q40    |                  99.16 |
| TPC-DS Q41    |                 836.88 |
| TPC-DS Q42    |                  78.75 |
| TPC-DS Q43    |                  20.13 |
| TPC-DS Q44    |                 355.45 |
| TPC-DS Q45    |                  74.21 |
| TPC-DS Q46    |                  24.50 |
| TPC-DS Q47    |                1291.81 |
| TPC-DS Q48    |                 477.99 |
| TPC-DS Q49    |                 337.34 |
| TPC-DS Q50    |                 322.67 |
| TPC-DS Q51    |                 647.80 |
| TPC-DS Q52    |                  64.51 |
| TPC-DS Q53    |                  77.70 |
| TPC-DS Q54    |                  59.66 |
| TPC-DS Q55    |                  60.45 |
| TPC-DS Q56    |                 328.74 |
| TPC-DS Q57    |                 631.76 |
| TPC-DS Q58    |                 314.77 |
| TPC-DS Q59    |                 283.69 |
| TPC-DS Q60    |                 303.22 |
| TPC-DS Q61    |                 103.00 |
| TPC-DS Q62    |                  73.62 |
| TPC-DS Q63    |                  80.76 |
| TPC-DS Q64    |                 470.03 |
| TPC-DS Q65    |                 398.39 |
| TPC-DS Q66    |                 156.18 |
| TPC-DS Q67    |                2285.21 |
| TPC-DS Q68    |                  28.89 |
| TPC-DS Q69    |                 203.61 |
| TPC-DS Q70    |                 315.67 |
| TPC-DS Q71    |                 268.66 |
| TPC-DS Q72    |                 797.64 |
| TPC-DS Q73    |                  20.99 |
| TPC-DS Q74    |                 871.89 |
| TPC-DS Q75    |                 640.75 |
| TPC-DS Q76    |                 151.48 |
| TPC-DS Q77    |                 231.52 |
| TPC-DS Q78    |                1407.08 |
| TPC-DS Q79    |                 146.38 |
| TPC-DS Q80    |                 400.49 |
| TPC-DS Q81    |               31846.33 |
| TPC-DS Q82    |                 283.54 |
| TPC-DS Q83    |                  67.09 |
| TPC-DS Q84    |                  16.57 |
| TPC-DS Q85    |                 224.90 |
| TPC-DS Q86    |                 186.61 |
| TPC-DS Q87    |                 965.92 |
| TPC-DS Q88    |                1928.92 |
| TPC-DS Q89    |                  80.89 |
| TPC-DS Q90    |                  92.20 |
| TPC-DS Q91    |                  70.07 |
| TPC-DS Q92    |                  53.68 |
| TPC-DS Q93    |                 143.70 |
| TPC-DS Q94    |                 151.05 |
| TPC-DS Q95    |                2716.96 |
| TPC-DS Q96    |                  70.52 |
| TPC-DS Q97    |                 282.26 |
| TPC-DS Q98    |                 140.80 |
| TPC-DS Q99    |                 107.29 |

### Errors (failed queries)

No errors

### Warnings (result mismatch)

No warnings

### Tests
* TEST passed: No SUT container restarts
* TEST passed: Geo Times [s] contains no 0 or NaN
* TEST passed: Power@Size [~Q/h] contains no 0 or NaN
* TEST passed: Throughput@Size contains no 0 or NaN
* TEST passed: No SQL errors
* TEST passed: No SQL warnings
* TEST passed: Workflow as planned
This gives a survey about the errors and warnings (result set mismatch) and the latencies of execution per query. Moreover the loading times (schema creation, ingestion and indexing), the geometric mean of query execution times and the TPC-DS metrics power and throughput are reported. Please note that the results are not suitable for being published as official TPC-DS results. In particular the refresh streams are missing.
To see the summary again you can simply call bexhoma summary -e 1750150367 with the experiment code.
For a more detailed query-wise evaluation you can call dbmsbenchmarker read -r ~/benchmarks/1750150367 -e yes.
To inspect result sets you can call python evaluate.py -r ~/benchmarks/ -e 1750150367 -q 4 resultsets (here: for query 4).
To compare result sets you can call dbmsinspect -r ~/benchmarks -c 1750150367 -q 4 (here: for query 4).
This shows the differences in result sets only.
Detailed Evaluation
Results are transformed into pandas DataFrames and can be inspected in more detail. Detailed evaluations can be done using DBMSBenchmarker
You can connect to an evaluation server in the cluster by bexhoma dashboard.
This forwards ports, so you have
a DBMSBenchmarker dashboard in browser at http://localhost:8050
a Jupyter notebook server at http://localhost:8888 containing the example notebooks
You can connect to a local evaluation server by bexhoma localdashboard.
This forwards ports, so you have
a DBMSBenchmarker dashboard in browser at http://localhost:8050
You can connect to a local jupyter server by bexhoma jupyter.
This forwards ports, so you have
a Jupyter notebook server at http://localhost:8888 containing the example notebooks
Adjust Parameters
The script supports
exact repetitions for statistical confidence
variations to scan a large parameters space
combine results for easy evaluation
There are various ways to change parameters.
Manifests
The YAML manifests for the components can be found in https://github.com/Beuth-Erdelt/Benchmark-Experiment-Host-Manager/tree/master/k8s
SQL Scrips
The SQL scripts for pre and post ingestion can be found in https://github.com/Beuth-Erdelt/Benchmark-Experiment-Host-Manager/tree/master/experiments/tpcds
Dockerfiles
The Dockerfiles for the components can be found in https://github.com/Beuth-Erdelt/Benchmark-Experiment-Host-Manager/tree/master/images/tpcds
Command line
You maybe want to adjust some of the parameters that are set in the file: python tpcds.py -h
usage: tpcds.py [-h] [-aws] [-dbms {PostgreSQL,MonetDB,MySQL,MariaDB}] [-xlit LIMIT_IMPORT_TABLE] [-db] [-sl] [-cx CONTEXT] [-e EXPERIMENT] [-m] [-mc] [-ms MAX_SUT] [-xdt] [-xqr NUM_RUN] [-nc NUM_CONFIG] [-ne NUM_QUERY_EXECUTORS] [-xnls NUM_LOADING_SPLIT]
                [-nlp NUM_LOADING_PODS] [-nlt NUM_LOADING_THREADS] [-nbp NUM_BENCHMARKING_PODS] [-nbt NUM_BENCHMARKING_THREADS] [-sf SCALING_FACTOR] [-t TIMEOUT] [-rr REQUEST_RAM] [-rc REQUEST_CPU] [-rct REQUEST_CPU_TYPE] [-rg REQUEST_GPU] [-rgt REQUEST_GPU_TYPE]
                [-rst {None,,local-hdd,shared}] [-rss REQUEST_STORAGE_SIZE] [-rnn REQUEST_NODE_NAME] [-rnl REQUEST_NODE_LOADING] [-rnb REQUEST_NODE_BENCHMARKING] [-tr] [-xii] [-xic] [-xis] [-xrcp] [-xshq]
                {profiling,run,start,load,empty,summary}

Performs a TPC-DS experiment. Data is generated and imported into a DBMS from a distributed filesystem (shared disk).

positional arguments:
  {profiling,run,start,load,empty,summary}
                        profile the import or run the TPC-DS queries

options:
  -h, --help            show this help message and exit
  -aws, --aws           fix components to node groups at AWS
  -dbms {PostgreSQL,MonetDB,MySQL,MariaDB}, --dbms {PostgreSQL,MonetDB,MySQL,MariaDB}
                        DBMS
  -xlit LIMIT_IMPORT_TABLE, --limit-import-table LIMIT_IMPORT_TABLE
                        limit import to one table, name of this table
  -db, --debug          dump debug informations
  -sl, --skip-loading   do not ingest, start benchmarking immediately
  -cx CONTEXT, --context CONTEXT
                        context of Kubernetes (for a multi cluster environment), default is current context
  -e EXPERIMENT, --experiment EXPERIMENT
                        sets experiment code for continuing started experiment
  -m, --monitoring      activates monitoring
  -mc, --monitoring-cluster
                        activates monitoring for all nodes of cluster
  -ms MAX_SUT, --max-sut MAX_SUT
                        maximum number of parallel DBMS configurations, default is no limit
  -xdt, --datatransfer   activates transfer of data per query (not only execution)
  -xqr NUM_RUN, --num-run NUM_RUN
                        number of runs per query
  -nc NUM_CONFIG, --num-config NUM_CONFIG
                        number of runs per configuration
  -ne NUM_QUERY_EXECUTORS, --num-query-executors NUM_QUERY_EXECUTORS
                        comma separated list of number of parallel clients
  -xnls NUM_LOADING_SPLIT, --num-loading-split NUM_LOADING_SPLIT
                        portion of loaders that should run in parallel
  -nlp NUM_LOADING_PODS, --num-loading-pods NUM_LOADING_PODS
                        total number of loaders per configuration
  -nlt NUM_LOADING_THREADS, --num-loading-threads NUM_LOADING_THREADS
                        total number of threads per loading process
  -nbp NUM_BENCHMARKING_PODS, --num-benchmarking-pods NUM_BENCHMARKING_PODS
                        comma separated list of number of benchmarkers per configuration
  -nbt NUM_BENCHMARKING_THREADS, --num-benchmarking-threads NUM_BENCHMARKING_THREADS
                        total number of threads per benchmarking process
  -sf SCALING_FACTOR, --scaling-factor SCALING_FACTOR
                        scaling factor (SF)
  -t TIMEOUT, --timeout TIMEOUT
                        timeout for a run of a query
  -rr REQUEST_RAM, --request-ram REQUEST_RAM
                        request ram for sut, default 16Gi
  -rc REQUEST_CPU, --request-cpu REQUEST_CPU
                        request cpus for sut, default 4
  -rct REQUEST_CPU_TYPE, --request-cpu-type REQUEST_CPU_TYPE
                        request node for sut to have node label cpu=
  -rg REQUEST_GPU, --request-gpu REQUEST_GPU
                        request number of gpus for sut
  -rgt REQUEST_GPU_TYPE, --request-gpu-type REQUEST_GPU_TYPE
                        request node for sut to have node label gpu=
  -rst {None,,local-hdd,shared}, --request-storage-type {None,,local-hdd,shared}
                        request persistent storage of certain type
  -rss REQUEST_STORAGE_SIZE, --request-storage-size REQUEST_STORAGE_SIZE
                        request persistent storage of certain size
  -rnn REQUEST_NODE_NAME, --request-node-name REQUEST_NODE_NAME
                        request a specific node for sut
  -rnl REQUEST_NODE_LOADING, --request-node-loading REQUEST_NODE_LOADING
                        request a specific node for loading pods
  -rnb REQUEST_NODE_BENCHMARKING, --request-node-benchmarking REQUEST_NODE_BENCHMARKING
                        request a specific node for benchmarking pods
  -tr, --test-result    test if result fulfills some basic requirements
  -xii, --init-indexes   adds indexes to tables after ingestion
  -xic, --init-constraints
                        adds constraints to tables after ingestion
  -xis, --init-statistics
                        recomputes statistics of tables after ingestion
  -xrcp, --recreate-parameter
                        recreate parameter for randomized queries
  -xshq, --shuffle-queries
                        have different orderings per stream
Monitoring
Monitoring can be activated for DBMS only (-m) or for all components (-mc).
Example:
bexhoma tpcds \
  -dbms PostgreSQL \
  -sf 3 \
  -nlp 8 \
  -nlt 8 \
  -xii -xic -xis \
  -xdt \
  -m \
  -mc \
  -ms $BEXHOMA_MS \
  -t 1200 \
  -tr \
  -lr 64Gi \
  -rr 64Gi \
  -rss 50Gi \
  -rnn $BEXHOMA_NODE_SUT -rnl $BEXHOMA_NODE_LOAD -rnb $BEXHOMA_NODE_BENCHMARK \
  run &>$LOG_DIR/docs_tpcds_postgresql_monitoring.log
If monitoring is activated, the summary also contains a section like this:
docs_tpcds_postgresql_monitoring.log
## Show Summary

### Workload
TPC-DS Queries SF=3
* Type: tpcds
* Duration: 1250s
* Code: 1783002163
* This includes the reading queries of TPC-DS.
* This experiment compares run time and resource consumption of TPC-DS queries in different DBMS.
  * TPC-DS (SF=3) data is loaded and benchmark is executed.
  * Query ordering is Q1 - Q99.
  * All instances use the same query parameters.
  * Timeout per query is 1200.
  * Import sets indexes and constraints after loading and recomputes statistics.
  * Experiment uses bexhoma version 0.10.2.
  * System metrics are monitored by a cluster-wide installation.
  * Experiment is limited to DBMS ['PostgreSQL'].
  * Import is handled by 8 processes (pods).
  * Loading is fixed to cl-worker19.
  * Benchmarking is fixed to cl-worker19.
  * Database uses ephemeral storage of size 45Gi.
  * Loading is tested with [8] threads, split into [8] pods.
  * Benchmarking is tested with [1] threads, split into [1] pods.
  * Benchmarking is run as [1] times the number of benchmarking pods.
  * Experiment is run once.

### Connections
* PostgreSQL-1-1-1-1-1 uses docker image postgres:18.3
  * RAM:2164173246464
  * CPU:INTEL(R) XEON(R) PLATINUM 8570
  * Cores:224
  * host:6.8.0-111-generic
  * node:cl-worker36
  * disk:702208
  * cpu_list:0-223
  * args:['-c', 'max_connections=640', '-c', 'max_worker_processes=16', '-c', 'max_parallel_workers=16', '-c', 'max_parallel_workers_per_gather=8', '-c', 'max_parallel_maintenance_workers=4', '-c', 'shared_buffers=16GB', '-c', 'effective_cache_size=40GB', '-c', 'work_mem=512MB', '-c', 'maintenance_work_mem=2GB', '-c', 'autovacuum=off', '-c', 'wal_level=minimal', '-c', 'max_wal_senders=0', '-c', 'max_wal_size=32GB', '-c', 'checkpoint_timeout=1h', '-c', 'checkpoint_completion_target=1.0', '-c', 'lock_timeout=30s', '-c', 'idle_in_transaction_session_timeout=30000']
  * requests_cpu:4
  * requests_memory:64Gi
  * limits_memory:64Gi
  * eval_parameters
    * code:1783002163

### SUT Container Restarts
* bexhoma-sut-postgresql-1-1783002163-95776b5f4-wmxbr: 0 0

### Workflow

#### Actual

* DBMS PostgreSQL-1 - Experiment 1 Client 1: tpcds (1 pods)

#### Planned

* DBMS PostgreSQL-1 - Experiment 1 Client 1: tpcds (1 pods)

### Loading

#### Per Run

|                |   experiment_run |   SF |   time_load |   time_preload |   time_generate |   time_ingest |   time_postload |   loading_pods |   terminals | tenant_id   | type_tenants   |   num_tenants | vol_tenants   |   Throughput [SF/h] |
|:---------------|-----------------:|-----:|------------:|---------------:|----------------:|--------------:|----------------:|---------------:|------------:|:------------|:---------------|--------------:|:--------------|--------------------:|
| PostgreSQL-1-1 |                1 | 3.00 |      476.00 |           1.00 |            1.00 |        153.00 |          314.00 |              8 |           0 |             | None           |             0 | False         |               22.69 |

### Execution

#### Per Connection

|                      | configuration   | phase            | job                |   experiment_run |   client |   benchmark_run |   pod_count |   SF |   num_of_queries |   time [s] |   Geo Times [s] |   Power@Size [~Q/h] |   Throughput@Size |   tenant_id | pod                  |
|:---------------------|:----------------|:-----------------|:-------------------|-----------------:|---------:|----------------:|------------:|-----:|-----------------:|-----------:|----------------:|--------------------:|------------------:|------------:|:---------------------|
| PostgreSQL-1-1-1-1-1 | PostgreSQL-1    | PostgreSQL-1-1-1 | PostgreSQL-1-1-1-1 |                1 |        1 |               1 |           1 | 3.00 |               99 |        622 |            0.60 |            18524.49 |           1718.97 |          -1 | PostgreSQL-1-1-1-1-1 |

#### Per Phase

|                  | phase            |   experiment_run |   client |   benchmark_run |   pod_count |   SF |   num_of_queries |   time [s] |   Geo Times [s] |   Power@Size [~Q/h] |   Throughput@Size |   tenant_id |
|:-----------------|:-----------------|-----------------:|---------:|----------------:|------------:|-----:|-----------------:|-----------:|----------------:|--------------------:|------------------:|------------:|
| PostgreSQL-1-1-1 | PostgreSQL-1-1-1 |                1 |        1 |               1 |           1 | 3.00 |               99 |        622 |            0.60 |            18524.49 |           1718.97 |          -1 |

### Latency of Timer Execution [ms]
| Queries       |   PostgreSQL-1-1-1-1-1 |
|:--------------|-----------------------:|
| TPC-DS Q1     |                 212.18 |
| TPC-DS Q2     |                 430.13 |
| TPC-DS Q3     |                 365.46 |
| TPC-DS Q4     |               16855.85 |
| TPC-DS Q5     |                 738.25 |
| TPC-DS Q6     |              191835.74 |
| TPC-DS Q7     |                 554.79 |
| TPC-DS Q8     |                 102.27 |
| TPC-DS Q9     |                2350.19 |
| TPC-DS Q10    |                1073.05 |
| TPC-DS Q11    |                9707.91 |
| TPC-DS Q12    |                 131.82 |
| TPC-DS Q13    |                1076.73 |
| TPC-DS Q14a+b |                6238.12 |
| TPC-DS Q15    |                 283.15 |
| TPC-DS Q16    |                 406.47 |
| TPC-DS Q17    |                 648.48 |
| TPC-DS Q18    |                 509.20 |
| TPC-DS Q19    |                 395.90 |
| TPC-DS Q20    |                 244.87 |
| TPC-DS Q21    |                 309.12 |
| TPC-DS Q22    |                6321.21 |
| TPC-DS Q23a+b |               11175.08 |
| TPC-DS Q24a+b |                1350.01 |
| TPC-DS Q25    |                 642.24 |
| TPC-DS Q26    |                 431.13 |
| TPC-DS Q27    |                  43.16 |
| TPC-DS Q28    |                1939.44 |
| TPC-DS Q29    |                 752.46 |
| TPC-DS Q30    |                6807.26 |
| TPC-DS Q31    |                3531.96 |
| TPC-DS Q32    |                 127.29 |
| TPC-DS Q33    |                 651.57 |
| TPC-DS Q34    |                  32.98 |
| TPC-DS Q35    |                1258.47 |
| TPC-DS Q36    |                  40.55 |
| TPC-DS Q37    |                 409.56 |
| TPC-DS Q38    |                2404.42 |
| TPC-DS Q39a+b |                4867.33 |
| TPC-DS Q40    |                 233.51 |
| TPC-DS Q41    |                 486.60 |
| TPC-DS Q42    |                 152.39 |
| TPC-DS Q43    |                  55.31 |
| TPC-DS Q44    |                   2.94 |
| TPC-DS Q45    |                 181.72 |
| TPC-DS Q46    |                  57.28 |
| TPC-DS Q47    |                2203.22 |
| TPC-DS Q48    |                1091.78 |
| TPC-DS Q49    |                 635.20 |
| TPC-DS Q50    |                1507.09 |
| TPC-DS Q51    |                1841.48 |
| TPC-DS Q52    |                 159.92 |
| TPC-DS Q53    |                 193.74 |
| TPC-DS Q54    |                  64.19 |
| TPC-DS Q55    |                 146.58 |
| TPC-DS Q56    |                 778.27 |
| TPC-DS Q57    |                1988.72 |
| TPC-DS Q58    |                 733.17 |
| TPC-DS Q59    |                 738.77 |
| TPC-DS Q60    |                 650.64 |
| TPC-DS Q61    |                  90.65 |
| TPC-DS Q62    |                 164.62 |
| TPC-DS Q63    |                 191.62 |
| TPC-DS Q64    |                1254.95 |
| TPC-DS Q65    |                1168.50 |
| TPC-DS Q66    |                 500.87 |
| TPC-DS Q67    |                7802.04 |
| TPC-DS Q68    |                  66.70 |
| TPC-DS Q69    |                 347.07 |
| TPC-DS Q70    |                 707.29 |
| TPC-DS Q71    |                 775.73 |
| TPC-DS Q72    |                2174.47 |
| TPC-DS Q73    |                  38.68 |
| TPC-DS Q74    |                2084.69 |
| TPC-DS Q75    |                3349.52 |
| TPC-DS Q76    |                 302.41 |
| TPC-DS Q77    |                 419.58 |
| TPC-DS Q78    |                3664.26 |
| TPC-DS Q79    |                 242.09 |
| TPC-DS Q80    |                 736.20 |
| TPC-DS Q81    |              275056.23 |
| TPC-DS Q82    |                 432.21 |
| TPC-DS Q83    |                 134.95 |
| TPC-DS Q84    |                  76.93 |
| TPC-DS Q85    |                 282.77 |
| TPC-DS Q86    |                 495.68 |
| TPC-DS Q87    |                2498.68 |
| TPC-DS Q88    |                2463.43 |
| TPC-DS Q89    |                 197.64 |
| TPC-DS Q90    |                 272.84 |
| TPC-DS Q91    |                 135.37 |
| TPC-DS Q92    |                  82.05 |
| TPC-DS Q93    |                 466.64 |
| TPC-DS Q94    |                 300.68 |
| TPC-DS Q95    |                6945.69 |
| TPC-DS Q96    |                 154.36 |
| TPC-DS Q97    |                 722.20 |
| TPC-DS Q98    |                 561.93 |
| TPC-DS Q99    |                 273.11 |

### Errors (failed queries)

No errors

### Warnings (result mismatch)

No warnings

### Monitoring

### Loading phase: SUT deployment

| DBMS               |   CPU [CPUs] |   Max CPU |   Max RAM [Gb] |   Max RAM Cached [Gb] |
|:-------------------|-------------:|----------:|---------------:|----------------------:|
| PostgreSQL-1-1-1-1 |       206.70 |      2.22 |           6.31 |                 12.99 |

### Loading phase: component data generator

| DBMS               |   CPU [CPUs] |   Max CPU |   Max RAM [Gb] |   Max RAM Cached [Gb] |
|:-------------------|-------------:|----------:|---------------:|----------------------:|
| PostgreSQL-1-1-1-1 |         0.00 |      0.00 |           0.00 |                  0.00 |

### Loading phase: component loader

| DBMS               |   CPU [CPUs] |   Max CPU |   Max RAM [Gb] |   Max RAM Cached [Gb] |
|:-------------------|-------------:|----------:|---------------:|----------------------:|
| PostgreSQL-1-1-1-1 |        33.73 |      0.36 |           0.01 |                  2.65 |

### Execution phase: SUT deployment

| DBMS               |   CPU [CPUs] |   Max CPU |   Max RAM [Gb] |   Max RAM Cached [Gb] |
|:-------------------|-------------:|----------:|---------------:|----------------------:|
| PostgreSQL-1-1-1-1 |       769.12 |      2.55 |           6.44 |                 13.12 |

### Execution phase: component benchmarker

| DBMS               |   CPU [CPUs] |   Max CPU |   Max RAM [Gb] |   Max RAM Cached [Gb] |
|:-------------------|-------------:|----------:|---------------:|----------------------:|
| PostgreSQL-1-1-1-1 |        21.58 |      0.14 |           0.32 |                  0.33 |

### Tests
* TEST passed: No SUT container restarts
* TEST passed: Loading phase: SUT deployment contains no 0 or NaN in CPU [CPUs]
* TEST skipped: Loading phase: component data generator contains 0 or NaN in CPU [CPUs] (data pre-existing)
* TEST passed: Loading phase: component loader contains no 0 or NaN in CPU [CPUs]
* TEST passed: Execution phase: SUT deployment contains no 0 or NaN in CPU [CPUs]
* TEST passed: Execution phase: component benchmarker contains no 0 or NaN in CPU [CPUs]
* TEST passed: Geo Times [s] contains no 0 or NaN
* TEST passed: Power@Size [~Q/h] contains no 0 or NaN
* TEST passed: Throughput@Size contains no 0 or NaN
* TEST passed: No SQL errors
* TEST passed: No SQL warnings
* TEST passed: Workflow as planned
This gives a survey about CPU (in CPU seconds) and RAM usage (in Gb) during loading and execution of the benchmark. MonetDB is fast, so we cannot see a lot (metrics are fetched every 30 seconds).
Perform Benchmark - Throughput Test
For performing the experiment we can run the tpcds file.
Example:
bexhoma tpcds \
  -dbms PostgreSQL \
  -sf 1 \
  -nc 1 \
  -ne 1,2 \
  -nlp 8 \
  -nlt 8 \
  -xii -xic -xis \
  -xdt \
  -ms $BEXHOMA_MS \
  -t 1200 \
  -tr \
  -lr 64Gi \
  -rr 64Gi \
  -rss 50Gi \
  -rnn $BEXHOMA_NODE_SUT -rnl $BEXHOMA_NODE_LOAD -rnb $BEXHOMA_NODE_BENCHMARK \
  run &>$LOG_DIR/docs_tpcds_postgresql_throughput.log
This runs 3 streams (-ne), the first one as a single stream and the following 2 in parallel.
docs_tpcds_postgresql_throughput.log
## Show Summary
### Workload
TPC-DS Queries SF=1
* Type: tpcds
* Duration: 825s
* Code: 1783003540
* This includes the reading queries of TPC-DS.
* This experiment compares run time and resource consumption of TPC-DS queries in different DBMS.
* TPC-DS (SF=1) data is loaded and benchmark is executed.
* Query ordering is Q1 - Q99.
* All instances use the same query parameters.
* Timeout per query is 1200.
* Import sets indexes and constraints after loading and recomputes statistics.
* Experiment uses bexhoma version 0.10.2.
* Experiment is limited to DBMS ['PostgreSQL'].
* Import is handled by 8 processes (pods).
* Loading is fixed to cl-worker19.
* Benchmarking is fixed to cl-worker19.
* Database uses ephemeral storage of size 15Gi.
* Loading is tested with [8] threads, split into [8] pods.
* Benchmarking is tested with [1] threads, split into [1] pods.
* Benchmarking is run as [1, 2] times the number of benchmarking pods.
* Experiment is run once.
### Connections
* PostgreSQL-1-1-1-1-1 uses docker image postgres:18.3
* RAM:2164173246464
* CPU:INTEL(R) XEON(R) PLATINUM 8570
* Cores:224
* host:6.8.0-111-generic
* node:cl-worker36
* disk:661164
* cpu_list:0-223
* args:['-c', 'max_connections=640', '-c', 'max_worker_processes=16', '-c', 'max_parallel_workers=16', '-c', 'max_parallel_workers_per_gather=8', '-c', 'max_parallel_maintenance_workers=4', '-c', 'shared_buffers=16GB', '-c', 'effective_cache_size=40GB', '-c', 'work_mem=512MB', '-c', 'maintenance_work_mem=2GB', '-c', 'autovacuum=off', '-c', 'wal_level=minimal', '-c', 'max_wal_senders=0', '-c', 'max_wal_size=32GB', '-c', 'checkpoint_timeout=1h', '-c', 'checkpoint_completion_target=1.0', '-c', 'lock_timeout=30s', '-c', 'idle_in_transaction_session_timeout=30000']
* requests_cpu:4
* requests_memory:64Gi
* limits_memory:64Gi
* eval_parameters
* code:1783003540
* PostgreSQL-1-1-2-1-1 uses docker image postgres:18.3
* RAM:2164173246464
* CPU:INTEL(R) XEON(R) PLATINUM 8570
* Cores:224
* host:6.8.0-111-generic
* node:cl-worker36
* disk:667688
* cpu_list:0-223
* args:['-c', 'max_connections=640', '-c', 'max_worker_processes=16', '-c', 'max_parallel_workers=16', '-c', 'max_parallel_workers_per_gather=8', '-c', 'max_parallel_maintenance_workers=4', '-c', 'shared_buffers=16GB', '-c', 'effective_cache_size=40GB', '-c', 'work_mem=512MB', '-c', 'maintenance_work_mem=2GB', '-c', 'autovacuum=off', '-c', 'wal_level=minimal', '-c', 'max_wal_senders=0', '-c', 'max_wal_size=32GB', '-c', 'checkpoint_timeout=1h', '-c', 'checkpoint_completion_target=1.0', '-c', 'lock_timeout=30s', '-c', 'idle_in_transaction_session_timeout=30000']
* requests_cpu:4
* requests_memory:64Gi
* limits_memory:64Gi
* eval_parameters
* code:1783003540
* PostgreSQL-1-1-2-1-2 uses docker image postgres:18.3
* RAM:2164173246464
* CPU:INTEL(R) XEON(R) PLATINUM 8570
* Cores:224
* host:6.8.0-111-generic
* node:cl-worker36
* disk:667688
* cpu_list:0-223
* args:['-c', 'max_connections=640', '-c', 'max_worker_processes=16', '-c', 'max_parallel_workers=16', '-c', 'max_parallel_workers_per_gather=8', '-c', 'max_parallel_maintenance_workers=4', '-c', 'shared_buffers=16GB', '-c', 'effective_cache_size=40GB', '-c', 'work_mem=512MB', '-c', 'maintenance_work_mem=2GB', '-c', 'autovacuum=off', '-c', 'wal_level=minimal', '-c', 'max_wal_senders=0', '-c', 'max_wal_size=32GB', '-c', 'checkpoint_timeout=1h', '-c', 'checkpoint_completion_target=1.0', '-c', 'lock_timeout=30s', '-c', 'idle_in_transaction_session_timeout=30000']
* requests_cpu:4
* requests_memory:64Gi
* limits_memory:64Gi
* eval_parameters
* code:1783003540
### SUT Container Restarts
* bexhoma-sut-postgresql-1-1783003540-5775b87fdd-qm55g: 0 0
### Workflow
#### Actual
* DBMS PostgreSQL-1 - Experiment 1 Client 1: tpcds (1 pods)
* DBMS PostgreSQL-1 - Experiment 1 Client 2: tpcds (2 pods)
#### Planned
* DBMS PostgreSQL-1 - Experiment 1 Client 1: tpcds (1 pods)
* DBMS PostgreSQL-1 - Experiment 1 Client 2: tpcds (2 pods)
### Loading
#### Per Run
| | experiment_run | SF | time_load | time_preload | time_generate | time_ingest | time_postload | loading_pods | terminals | tenant_id | type_tenants | num_tenants | vol_tenants | Throughput [SF/h] |
|:---------------|-----------------:|-----:|------------:|---------------:|----------------:|--------------:|----------------:|---------------:|------------:|:------------|:---------------|--------------:|:--------------|--------------------:|
| PostgreSQL-1-1 | 1 | 1.00 | 234.00 | 1.00 | 1.00 | 55.00 | 171.00 | 8 | 0 | | None | 0 | False | 15.38 |
### Execution
#### Per Connection
| | configuration | phase | job | experiment_run | client | benchmark_run | pod_count | SF | num_of_queries | time [s] | Geo Times [s] | Power@Size [~Q/h] | Throughput@Size | tenant_id | pod |
|:---------------------|:----------------|:-----------------|:-------------------|-----------------:|---------:|----------------:|------------:|-----:|-----------------:|-----------:|----------------:|--------------------:|------------------:|------------:|:---------------------|
| PostgreSQL-1-1-1-1-1 | PostgreSQL-1 | PostgreSQL-1-1-1 | PostgreSQL-1-1-1-1 | 1 | 1 | 1 | 1 | 1.00 | 99 | 156 | 0.28 | 13297.90 | 2284.62 | -1 | PostgreSQL-1-1-1-1-1 |
| PostgreSQL-1-1-2-1-1 | PostgreSQL-1 | PostgreSQL-1-1-2 | PostgreSQL-1-1-2-1 | 1 | 2 | 1 | 1 | 1.00 | 99 | 158 | 0.29 | 12807.85 | 2255.70 | -1 | PostgreSQL-1-1-2-1-1 |
| PostgreSQL-1-1-2-1-2 | PostgreSQL-1 | PostgreSQL-1-1-2 | PostgreSQL-1-1-2-1 | 1 | 2 | 1 | 1 | 1.00 | 99 | 159 | 0.29 | 12981.09 | 2241.51 | -1 | PostgreSQL-1-1-2-1-2 |
#### Per Phase
| | phase | experiment_run | client | benchmark_run | pod_count | SF | num_of_queries | time [s] | Geo Times [s] | Power@Size [~Q/h] | Throughput@Size | tenant_id |
|:-----------------|:-----------------|-----------------:|---------:|----------------:|------------:|-----:|-----------------:|-----------:|----------------:|--------------------:|------------------:|------------:|
| PostgreSQL-1-1-1 | PostgreSQL-1-1-1 | 1 | 1 | 1 | 1 | 1.00 | 99 | 156 | 0.28 | 13297.90 | 2284.62 | -1 |
| PostgreSQL-1-1-2 | PostgreSQL-1-1-2 | 1 | 2 | 1 | 2 | 1.00 | 198 | 159 | 0.29 | 12894.18 | 4483.02 | -1 |
### Latency of Timer Execution [ms]
| Queries | PostgreSQL-1-1-1-1-1 | PostgreSQL-1-1-2-1-1 | PostgreSQL-1-1-2-1-2 |
|:--------------|-----------------------:|-----------------------:|-----------------------:|
| TPC-DS Q1 | 96.64 | 92.58 | 101.45 |
| TPC-DS Q2 | 186.01 | 191.03 | 186.61 |
| TPC-DS Q3 | 157.97 | 121.51 | 137.89 |
| TPC-DS Q4 | 6402.66 | 6457.47 | 6648.31 |
| TPC-DS Q5 | 354.76 | 360.69 | 377.02 |
| TPC-DS Q6 | 48095.61 | 49173.45 | 50424.06 |
| TPC-DS Q7 | 280.46 | 311.66 | 313.93 |
| TPC-DS Q8 | 47.04 | 56.88 | 50.82 |
| TPC-DS Q9 | 1760.23 | 1813.60 | 1927.49 |
| TPC-DS Q10 | 880.00 | 926.47 | 923.13 |
| TPC-DS Q11 | 4025.71 | 4294.87 | 4312.00 |
| TPC-DS Q12 | 51.26 | 60.37 | 62.11 |
| TPC-DS Q13 | 479.51 | 561.50 | 509.76 |
| TPC-DS Q14a+b | 1508.03 | 1748.11 | 1610.38 |
| TPC-DS Q15 | 91.80 | 113.24 | 108.80 |
| TPC-DS Q16 | 148.25 | 175.39 | 176.08 |
| TPC-DS Q17 | 269.48 | 283.81 | 281.83 |
| TPC-DS Q18 | 347.29 | 354.70 | 356.82 |
| TPC-DS Q19 | 122.08 | 131.67 | 136.05 |
| TPC-DS Q20 | 92.39 | 97.22 | 93.94 |
| TPC-DS Q21 | 172.64 | 173.06 | 175.05 |
| TPC-DS Q22 | 2617.90 | 2608.64 | 2848.36 |
| TPC-DS Q23a+b | 4462.86 | 4368.07 | 4547.74 |
| TPC-DS Q24a+b | 525.91 | 669.84 | 652.23 |
| TPC-DS Q25 | 257.09 | 277.92 | 275.30 |
| TPC-DS Q26 | 197.66 | 214.41 | 216.08 |
| TPC-DS Q27 | 24.58 | 17.54 | 18.82 |
| TPC-DS Q28 | 593.32 | 587.21 | 567.17 |
| TPC-DS Q29 | 266.71 | 288.01 | 286.08 |
| TPC-DS Q30 | 7772.82 | 7691.25 | 7433.46 |
| TPC-DS Q31 | 1415.47 | 1389.54 | 1316.38 |
| TPC-DS Q32 | 84.92 | 87.58 | 84.76 |
| TPC-DS Q33 | 286.15 | 302.06 | 300.67 |
| TPC-DS Q34 | 23.29 | 17.84 | 19.59 |
| TPC-DS Q35 | 1001.61 | 978.84 | 957.15 |
| TPC-DS Q36 | 20.74 | 20.36 | 20.07 |
| TPC-DS Q37 | 324.18 | 235.91 | 327.35 |
| TPC-DS Q38 | 1026.07 | 1085.39 | 1053.35 |
| TPC-DS Q39a+b | 2077.00 | 2069.57 | 1997.07 |
| TPC-DS Q40 | 98.99 | 114.20 | 101.08 |
| TPC-DS Q41 | 803.52 | 770.11 | 725.23 |
| TPC-DS Q42 | 62.86 | 68.99 | 67.16 |
| TPC-DS Q43 | 125.44 | 130.73 | 130.11 |
| TPC-DS Q44 | 1.99 | 1.79 | 2.10 |
| TPC-DS Q45 | 67.99 | 75.08 | 77.88 |
| TPC-DS Q46 | 26.61 | 25.59 | 24.71 |
| TPC-DS Q47 | 1398.39 | 1494.71 | 1468.07 |
| TPC-DS Q48 | 490.24 | 537.55 | 520.69 |
| TPC-DS Q49 | 325.20 | 333.48 | 348.73 |
| TPC-DS Q50 | 417.19 | 406.20 | 395.51 |
| TPC-DS Q51 | 675.97 | 718.11 | 693.52 |
| TPC-DS Q52 | 62.76 | 65.47 | 70.28 |
| TPC-DS Q53 | 87.07 | 84.05 | 85.07 |
| TPC-DS Q54 | 64.49 | 66.47 | 65.26 |
| TPC-DS Q55 | 64.78 | 63.98 | 64.03 |
| TPC-DS Q56 | 306.66 | 349.60 | 351.73 |
| TPC-DS Q57 | 657.07 | 774.65 | 758.43 |
| TPC-DS Q58 | 357.99 | 393.70 | 332.19 |
| TPC-DS Q59 | 328.95 | 294.52 | 292.72 |
| TPC-DS Q60 | 324.67 | 377.53 | 344.02 |
| TPC-DS Q61 | 109.43 | 126.72 | 105.31 |
| TPC-DS Q62 | 78.07 | 83.52 | 77.87 |
| TPC-DS Q63 | 83.51 | 81.53 | 82.54 |
| TPC-DS Q64 | 623.12 | 665.23 | 603.97 |
| TPC-DS Q65 | 454.39 | 441.39 | 463.02 |
| TPC-DS Q66 | 183.85 | 197.11 | 179.95 |
| TPC-DS Q67 | 2405.04 | 2516.59 | 2390.15 |
| TPC-DS Q68 | 32.18 | 31.76 | 28.36 |
| TPC-DS Q69 | 95.25 | 97.62 | 98.62 |
| TPC-DS Q70 | 304.99 | 301.76 | 304.48 |
| TPC-DS Q71 | 253.53 | 285.17 | 297.57 |
| TPC-DS Q72 | 809.68 | 811.45 | 776.90 |
| TPC-DS Q73 | 21.68 | 22.38 | 20.24 |
| TPC-DS Q74 | 914.83 | 939.04 | 989.04 |
| TPC-DS Q75 | 697.46 | 807.14 | 685.27 |
| TPC-DS Q76 | 189.71 | 185.46 | 195.65 |
| TPC-DS Q77 | 235.39 | 249.89 | 243.21 |
| TPC-DS Q78 | 1016.10 | 1108.89 | 1051.40 |
| TPC-DS Q79 | 123.66 | 131.93 | 127.78 |
| TPC-DS Q80 | 362.99 | 388.03 | 405.34 |
| TPC-DS Q81 | 31698.12 | 33724.37 | 31582.22 |
| TPC-DS Q82 | 258.48 | 242.48 | 226.05 |
| TPC-DS Q83 | 78.00 | 76.53 | 74.84 |
| TPC-DS Q84 | 67.77 | 77.45 | 66.61 |
| TPC-DS Q85 | 247.70 | 244.20 | 247.63 |
| TPC-DS Q86 | 170.52 | 191.47 | 180.36 |
| TPC-DS Q87 | 1015.55 | 1133.78 | 1103.50 |
| TPC-DS Q88 | 1977.63 | 2130.12 | 2042.32 |
| TPC-DS Q89 | 87.43 | 94.19 | 98.03 |
| TPC-DS Q90 | 91.91 | 111.53 | 112.24 |
| TPC-DS Q91 | 69.02 | 85.30 | 75.70 |
| TPC-DS Q92 | 59.71 | 52.46 | 49.98 |
| TPC-DS Q93 | 175.05 | 159.89 | 164.42 |
| TPC-DS Q94 | 125.44 | 148.74 | 136.50 |
| TPC-DS Q95 | 2690.75 | 2917.15 | 2809.95 |
| TPC-DS Q96 | 76.15 | 71.25 | 73.41 |
| TPC-DS Q97 | 272.67 | 292.16 | 293.43 |
| TPC-DS Q98 | 129.91 | 146.19 | 144.26 |
| TPC-DS Q99 | 111.03 | 116.92 | 115.88 |
### Errors (failed queries)
No errors
### Warnings (result mismatch)
| | TPC-DS Q1 | TPC-DS Q2 | TPC-DS Q3 | TPC-DS Q4 | TPC-DS Q5 | TPC-DS Q6 | TPC-DS Q7 | TPC-DS Q8 | TPC-DS Q9 | TPC-DS Q10 | TPC-DS Q11 | TPC-DS Q12 | TPC-DS Q13 | TPC-DS Q14a+b | TPC-DS Q15 | TPC-DS Q16 | TPC-DS Q17 | TPC-DS Q18 | TPC-DS Q19 | TPC-DS Q20 | TPC-DS Q21 | TPC-DS Q22 | TPC-DS Q23a+b | TPC-DS Q24a+b | TPC-DS Q25 | TPC-DS Q26 | TPC-DS Q27 | TPC-DS Q28 | TPC-DS Q29 | TPC-DS Q30 | TPC-DS Q31 | TPC-DS Q32 | TPC-DS Q33 | TPC-DS Q34 | TPC-DS Q35 | TPC-DS Q36 | TPC-DS Q37 | TPC-DS Q38 | TPC-DS Q39a+b | TPC-DS Q40 | TPC-DS Q41 | TPC-DS Q42 | TPC-DS Q43 | TPC-DS Q44 | TPC-DS Q45 | TPC-DS Q46 | TPC-DS Q47 | TPC-DS Q48 | TPC-DS Q49 | TPC-DS Q50 | TPC-DS Q51 | TPC-DS Q52 | TPC-DS Q53 | TPC-DS Q54 | TPC-DS Q55 | TPC-DS Q56 | TPC-DS Q57 | TPC-DS Q58 | TPC-DS Q59 | TPC-DS Q60 | TPC-DS Q61 | TPC-DS Q62 | TPC-DS Q63 | TPC-DS Q64 | TPC-DS Q65 | TPC-DS Q66 | TPC-DS Q67 | TPC-DS Q68 | TPC-DS Q69 | TPC-DS Q70 | TPC-DS Q71 | TPC-DS Q72 | TPC-DS Q73 | TPC-DS Q74 | TPC-DS Q75 | TPC-DS Q76 | TPC-DS Q77 | TPC-DS Q78 | TPC-DS Q79 | TPC-DS Q80 | TPC-DS Q81 | TPC-DS Q82 | TPC-DS Q83 | TPC-DS Q84 | TPC-DS Q85 | TPC-DS Q86 | TPC-DS Q87 | TPC-DS Q88 | TPC-DS Q89 | TPC-DS Q90 | TPC-DS Q91 | TPC-DS Q92 | TPC-DS Q93 | TPC-DS Q94 | TPC-DS Q95 | TPC-DS Q96 | TPC-DS Q97 | TPC-DS Q98 | TPC-DS Q99 |
|:---------------------|------------:|------------:|------------:|------------:|------------:|------------:|------------:|------------:|------------:|-------------:|-------------:|-------------:|-------------:|----------------:|-------------:|-------------:|-------------:|-------------:|-------------:|-------------:|-------------:|-------------:|----------------:|----------------:|-------------:|-------------:|-------------:|-------------:|-------------:|-------------:|-------------:|-------------:|-------------:|-------------:|-------------:|-------------:|-------------:|-------------:|----------------:|-------------:|-------------:|-------------:|-------------:|-------------:|-------------:|-------------:|-------------:|-------------:|-------------:|-------------:|-------------:|-------------:|-------------:|-------------:|-------------:|-------------:|-------------:|-------------:|-------------:|-------------:|-------------:|-------------:|-------------:|-------------:|-------------:|-------------:|-------------:|-------------:|-------------:|-------------:|-------------:|-------------:|-------------:|-------------:|-------------:|-------------:|-------------:|-------------:|-------------:|-------------:|-------------:|-------------:|-------------:|-------------:|-------------:|-------------:|-------------:|-------------:|-------------:|-------------:|-------------:|-------------:|-------------:|-------------:|-------------:|-------------:|-------------:|-------------:|-------------:|
| PostgreSQL-1-1-1-1-1 | 0.00 | 0.00 | 0.00 | 0.00 | 0.00 | 0.00 | 0.00 | 0.00 | 0.00 | 0.00 | 0.00 | 0.00 | 0.00 | 0.00 | 0.00 | 0.00 | 0.00 | 0.00 | 0.00 | 0.00 | 0.00 | 0.00 | 0.00 | 0.00 | 0.00 | 0.00 | 0.00 | 0.00 | 0.00 | 0.00 | 0.00 | 0.00 | 0.00 | 0.00 | 0.00 | 0.00 | 0.00 | 0.00 | 1.00 | 0.00 | 0.00 | 0.00 | 0.00 | 0.00 | 0.00 | 0.00 | 0.00 | 0.00 | 0.00 | 0.00 | 0.00 | 0.00 | 0.00 | 0.00 | 0.00 | 0.00 | 0.00 | 0.00 | 0.00 | 0.00 | 0.00 | 0.00 | 0.00 | 0.00 | 0.00 | 0.00 | 0.00 | 0.00 | 0.00 | 0.00 | 0.00 | 0.00 | 0.00 | 0.00 | 0.00 | 0.00 | 0.00 | 0.00 | 0.00 | 0.00 | 0.00 | 0.00 | 0.00 | 0.00 | 0.00 | 0.00 | 0.00 | 0.00 | 0.00 | 0.00 | 0.00 | 0.00 | 0.00 | 0.00 | 0.00 | 0.00 | 0.00 | 0.00 | 0.00 |
| PostgreSQL-1-1-2-1-2 | 0.00 | 0.00 | 0.00 | 0.00 | 0.00 | 0.00 | 0.00 | 0.00 | 0.00 | 0.00 | 0.00 | 0.00 | 0.00 | 0.00 | 0.00 | 0.00 | 0.00 | 0.00 | 0.00 | 0.00 | 0.00 | 0.00 | 0.00 | 0.00 | 0.00 | 0.00 | 0.00 | 0.00 | 0.00 | 0.00 | 0.00 | 0.00 | 0.00 | 0.00 | 0.00 | 0.00 | 0.00 | 0.00 | 1.00 | 0.00 | 0.00 | 0.00 | 0.00 | 0.00 | 0.00 | 0.00 | 0.00 | 0.00 | 0.00 | 0.00 | 0.00 | 0.00 | 0.00 | 0.00 | 0.00 | 0.00 | 0.00 | 0.00 | 0.00 | 0.00 | 0.00 | 0.00 | 0.00 | 0.00 | 0.00 | 0.00 | 0.00 | 0.00 | 0.00 | 0.00 | 0.00 | 0.00 | 0.00 | 0.00 | 0.00 | 0.00 | 0.00 | 0.00 | 0.00 | 0.00 | 0.00 | 0.00 | 0.00 | 0.00 | 0.00 | 0.00 | 0.00 | 0.00 | 0.00 | 0.00 | 0.00 | 0.00 | 0.00 | 0.00 | 0.00 | 0.00 | 0.00 | 0.00 | 0.00 |
### Tests
* TEST passed: No SUT container restarts
* TEST passed: Geo Times [s] contains no 0 or NaN
* TEST passed: Power@Size [~Q/h] contains no 0 or NaN
* TEST passed: Throughput@Size contains no 0 or NaN
* TEST passed: No SQL errors
* TEST failed: SQL warnings (result mismatch)
* TEST passed: Workflow as planned
All executions use the same database, so loading times are the same.
Per default, all 3 streams use the same random parameters (like YEAR in Q1) and run in ordering Q1-Q99. You can change this via
-xrcp: Each stream has it’s own random parameters-xshq: Use the ordering per stream as required by the TPC-DS specification
Use Persistent Storage
The default behaviour of bexhoma is that the database is stored inside the ephemeral storage of the Docker container. If your cluster allows dynamic provisioning of volumes, you might request a persistent storage of a certain type (storageClass) and size.
Example:
bexhoma tpcds \
  -dbms PostgreSQL \
  -sf 1 \
  -nc 2 \
  -nlp 8 \
  -nlt 8 \
  -xii -xic -xis \
  -xdt \
  -ms $BEXHOMA_MS \
  -t 1200 \
  -tr \
  -lr 64Gi \
  -rr 64Gi \
  -rsr \
  -rss 50Gi \
  -rst $BEXHOMA_STORAGE_CLASS \
  -rnn $BEXHOMA_NODE_SUT -rnl $BEXHOMA_NODE_LOAD -rnb $BEXHOMA_NODE_BENCHMARK \
  run &>$LOG_DIR/docs_tpcds_postgresql_storage.log
The following status shows we have a volumes of type shared.
Every experiment running TPC-DS of SF=1 at MonetDB will take the database from this volume and skip loading.
In this example -nc is set to two, that is the complete experiment is repeated twice for statistical confidence.
The first instance of MonetDB mounts the volume and generates the data.
All other instances just use the database without generating and loading data.
+-----------------------------------------+-----------------+--------------+--------------+-------------------+------------+----------------------+-----------+----------+--------+--------+
| Volumes                                 | configuration   | experiment   | loaded [s]   |   timeLoading [s] | dbms       | storage_class_name   | storage   | status   | size   | used   |
+=========================================+=================+==============+==============+===================+============+======================+===========+==========+========+========+
| bexhoma-storage-monetdb-tpcds-1         | monetdb         | tpcds-1      | True         |               151 | MonetDB    | shared               | 30Gi      | Bound    | 10G    | 2.0G   |
+-----------------------------------------+-----------------+--------------+--------------+-------------------+------------+----------------------+-----------+----------+--------+--------+
| bexhoma-storage-monetdb-tpcds-3         | monetdb         | tpcds-3      | True         |               393 | MonetDB    | shared               | 100Gi     | Bound    | 100G   | 5.4G   |
+-----------------------------------------+-----------------+--------------+--------------+-------------------+------------+----------------------+-----------+----------+--------+--------+
| bexhoma-storage-monetdb-tpcds-100       | monetdb         | tpcds-100    | True         |              4019 | MonetDB    | shared               | 300Gi     | Bound    | 300G   | 156G   |
+-----------------------------------------+-----------------+--------------+--------------+-------------------+------------+----------------------+-----------+----------+--------+--------+

+---------------+--------------+--------------+---------------+
| 1707740320    | sut          |   loaded [s] | benchmarker   |
+===============+==============+==============+===============+
| MonetDB-BHT-8 | (1. Running) |       185.41 | (1. Running)  |
+---------------+--------------+--------------+---------------+
The result looks something like
docs_tpcds_postgresql_storage.log
## Show Summary
### Workload
TPC-DS Queries SF=1
* Type: tpcds
* Duration: 1162s
* Code: 1783004499
* This includes the reading queries of TPC-DS.
* This experiment compares run time and resource consumption of TPC-DS queries in different DBMS.
* TPC-DS (SF=1) data is loaded and benchmark is executed.
* Query ordering is Q1 - Q99.
* All instances use the same query parameters.
* Timeout per query is 1200.
* Import sets indexes and constraints after loading and recomputes statistics.
* Experiment uses bexhoma version 0.10.2.
* Experiment is limited to DBMS ['PostgreSQL'].
* Import is handled by 8 processes (pods).
* Loading is fixed to cl-worker19.
* Benchmarking is fixed to cl-worker19.
* Database is persisted to disk of type shared and size 50Gi.
* Loading is tested with [8] threads, split into [8] pods.
* Benchmarking is tested with [1] threads, split into [1] pods.
* Benchmarking is run as [1] times the number of benchmarking pods.
* Experiment is run 2 times.
### Connections
* PostgreSQL-1-1-1-1-1 uses docker image postgres:18.3
* RAM:2164173246464
* CPU:INTEL(R) XEON(R) PLATINUM 8570
* Cores:224
* host:6.8.0-111-generic
* node:cl-worker36
* disk:659518
* volume_size:50G
* volume_used:5.7G
* cpu_list:0-223
* args:['-c', 'max_connections=640', '-c', 'max_worker_processes=16', '-c', 'max_parallel_workers=16', '-c', 'max_parallel_workers_per_gather=8', '-c', 'max_parallel_maintenance_workers=4', '-c', 'shared_buffers=16GB', '-c', 'effective_cache_size=40GB', '-c', 'work_mem=512MB', '-c', 'maintenance_work_mem=2GB', '-c', 'autovacuum=off', '-c', 'wal_level=minimal', '-c', 'max_wal_senders=0', '-c', 'max_wal_size=32GB', '-c', 'checkpoint_timeout=1h', '-c', 'checkpoint_completion_target=1.0', '-c', 'lock_timeout=30s', '-c', 'idle_in_transaction_session_timeout=30000']
* requests_cpu:4
* requests_memory:64Gi
* limits_memory:64Gi
* eval_parameters
* code:1783004499
* PostgreSQL-1-2-1-1-1 uses docker image postgres:18.3
* RAM:1081853939712
* CPU:Intel(R) Xeon(R) Gold 6438Y+
* Cores:128
* host:6.8.0-111-generic
* node:cl-worker37
* disk:694787
* volume_size:50G
* volume_used:5.7G
* cpu_list:0-127
* args:['-c', 'max_connections=640', '-c', 'max_worker_processes=16', '-c', 'max_parallel_workers=16', '-c', 'max_parallel_workers_per_gather=8', '-c', 'max_parallel_maintenance_workers=4', '-c', 'shared_buffers=16GB', '-c', 'effective_cache_size=40GB', '-c', 'work_mem=512MB', '-c', 'maintenance_work_mem=2GB', '-c', 'autovacuum=off', '-c', 'wal_level=minimal', '-c', 'max_wal_senders=0', '-c', 'max_wal_size=32GB', '-c', 'checkpoint_timeout=1h', '-c', 'checkpoint_completion_target=1.0', '-c', 'lock_timeout=30s', '-c', 'idle_in_transaction_session_timeout=30000']
* requests_cpu:4
* requests_memory:64Gi
* limits_memory:64Gi
* eval_parameters
* code:1783004499
### SUT Container Restarts
* bexhoma-sut-postgresql-1-1783004499-d8fb7cb7d-7bvs4: 0 0
### Workflow
#### Actual
* DBMS PostgreSQL-1 - Experiment 1 Client 1: tpcds (1 pods)
* DBMS PostgreSQL-1 - Experiment 2 Client 1: tpcds (1 pods)
#### Planned
* DBMS PostgreSQL-1 - Experiment 1 Client 1: tpcds (1 pods)
* DBMS PostgreSQL-1 - Experiment 2 Client 1: tpcds (1 pods)
### Loading
#### Per Run
| | experiment_run | SF | time_load | time_preload | time_generate | time_ingest | time_postload | loading_pods | terminals | tenant_id | type_tenants | num_tenants | vol_tenants | Throughput [SF/h] |
|:---------------|-----------------:|-----:|------------:|---------------:|----------------:|--------------:|----------------:|---------------:|------------:|:------------|:---------------|--------------:|:--------------|--------------------:|
| PostgreSQL-1-1 | 1 | 1.00 | 315.00 | 2.00 | 1.00 | 92.00 | 212.00 | 8 | 0 | | None | 0 | False | 11.43 |
| PostgreSQL-1-2 | 2 | 1.00 | 315.00 | 2.00 | 1.00 | 92.00 | 212.00 | 8 | 0 | | None | 0 | False | 11.43 |
### Execution
#### Per Connection
| | configuration | phase | job | experiment_run | client | benchmark_run | pod_count | SF | num_of_queries | time [s] | Geo Times [s] | Power@Size [~Q/h] | Throughput@Size | tenant_id | pod |
|:---------------------|:----------------|:-----------------|:-------------------|-----------------:|---------:|----------------:|------------:|-----:|-----------------:|-----------:|----------------:|--------------------:|------------------:|------------:|:---------------------|
| PostgreSQL-1-1-1-1-1 | PostgreSQL-1 | PostgreSQL-1-1-1 | PostgreSQL-1-1-1-1 | 1 | 1 | 1 | 1 | 1.00 | 99 | 158 | 0.28 | 13381.77 | 2255.70 | -1 | PostgreSQL-1-1-1-1-1 |
| PostgreSQL-1-2-1-1-1 | PostgreSQL-1 | PostgreSQL-1-2-1 | PostgreSQL-1-2-1-1 | 2 | 1 | 1 | 1 | 1.00 | 99 | 204 | 0.46 | 7995.96 | 1747.06 | -1 | PostgreSQL-1-2-1-1-1 |
#### Per Phase
| | phase | experiment_run | client | benchmark_run | pod_count | SF | num_of_queries | time [s] | Geo Times [s] | Power@Size [~Q/h] | Throughput@Size | tenant_id |
|:-----------------|:-----------------|-----------------:|---------:|----------------:|------------:|-----:|-----------------:|-----------:|----------------:|--------------------:|------------------:|------------:|
| PostgreSQL-1-1-1 | PostgreSQL-1-1-1 | 1 | 1 | 1 | 1 | 1.00 | 99 | 158 | 0.28 | 13381.77 | 2255.70 | -1 |
| PostgreSQL-1-2-1 | PostgreSQL-1-2-1 | 2 | 1 | 1 | 1 | 1.00 | 99 | 204 | 0.46 | 7995.96 | 1747.06 | -1 |
### Latency of Timer Execution [ms]
| Queries | PostgreSQL-1-1-1-1-1 | PostgreSQL-1-2-1-1-1 |
|:--------------|-----------------------:|-----------------------:|
| TPC-DS Q1 | 107.54 | 2776.80 |
| TPC-DS Q2 | 194.93 | 6862.96 |
| TPC-DS Q3 | 149.57 | 7353.38 |
| TPC-DS Q4 | 6835.02 | 8620.65 |
| TPC-DS Q5 | 378.55 | 2468.17 |
| TPC-DS Q6 | 50557.14 | 48326.76 |
| TPC-DS Q7 | 310.61 | 4079.13 |
| TPC-DS Q8 | 48.55 | 102.19 |
| TPC-DS Q9 | 1699.03 | 2363.03 |
| TPC-DS Q10 | 869.95 | 2482.00 |
| TPC-DS Q11 | 4021.85 | 5540.33 |
| TPC-DS Q12 | 52.52 | 54.76 |
| TPC-DS Q13 | 478.56 | 662.76 |
| TPC-DS Q14a+b | 1489.65 | 1852.34 |
| TPC-DS Q15 | 100.31 | 104.93 |
| TPC-DS Q16 | 162.16 | 373.82 |
| TPC-DS Q17 | 248.98 | 314.04 |
| TPC-DS Q18 | 342.17 | 523.88 |
| TPC-DS Q19 | 122.12 | 191.31 |
| TPC-DS Q20 | 76.50 | 123.55 |
| TPC-DS Q21 | 178.77 | 6173.56 |
| TPC-DS Q22 | 2566.02 | 4666.60 |
| TPC-DS Q23a+b | 4212.32 | 4724.83 |
| TPC-DS Q24a+b | 464.37 | 611.94 |
| TPC-DS Q25 | 239.44 | 287.09 |
| TPC-DS Q26 | 184.27 | 307.21 |
| TPC-DS Q27 | 16.57 | 30.63 |
| TPC-DS Q28 | 553.89 | 814.15 |
| TPC-DS Q29 | 244.18 | 309.03 |
| TPC-DS Q30 | 7300.68 | 7280.20 |
| TPC-DS Q31 | 1330.02 | 1247.85 |
| TPC-DS Q32 | 95.68 | 150.31 |
| TPC-DS Q33 | 325.85 | 543.61 |
| TPC-DS Q34 | 19.76 | 36.86 |
| TPC-DS Q35 | 970.58 | 1706.41 |
| TPC-DS Q36 | 18.00 | 33.13 |
| TPC-DS Q37 | 180.34 | 306.64 |
| TPC-DS Q38 | 1090.26 | 1864.50 |
| TPC-DS Q39a+b | 1846.09 | 2749.98 |
| TPC-DS Q40 | 95.72 | 122.01 |
| TPC-DS Q41 | 788.81 | 691.03 |
| TPC-DS Q42 | 69.74 | 78.27 |
| TPC-DS Q43 | 19.16 | 30.54 |
| TPC-DS Q44 | 318.50 | 640.52 |
| TPC-DS Q45 | 75.25 | 78.59 |
| TPC-DS Q46 | 26.76 | 41.92 |
| TPC-DS Q47 | 1264.37 | 1485.98 |
| TPC-DS Q48 | 464.96 | 592.03 |
| TPC-DS Q49 | 341.61 | 432.20 |
| TPC-DS Q50 | 401.25 | 417.40 |
| TPC-DS Q51 | 676.37 | 714.80 |
| TPC-DS Q52 | 65.38 | 87.22 |
| TPC-DS Q53 | 70.93 | 98.27 |
| TPC-DS Q54 | 63.38 | 84.75 |
| TPC-DS Q55 | 62.87 | 87.89 |
| TPC-DS Q56 | 294.97 | 404.26 |
| TPC-DS Q57 | 579.63 | 720.18 |
| TPC-DS Q58 | 312.16 | 384.34 |
| TPC-DS Q59 | 281.02 | 408.83 |
| TPC-DS Q60 | 273.32 | 328.22 |
| TPC-DS Q61 | 83.87 | 108.63 |
| TPC-DS Q62 | 75.66 | 180.11 |
| TPC-DS Q63 | 76.41 | 114.28 |
| TPC-DS Q64 | 479.46 | 871.14 |
| TPC-DS Q65 | 403.04 | 744.14 |
| TPC-DS Q66 | 163.56 | 608.41 |
| TPC-DS Q67 | 2305.76 | 4383.45 |
| TPC-DS Q68 | 32.63 | 48.80 |
| TPC-DS Q69 | 195.52 | 362.03 |
| TPC-DS Q70 | 285.88 | 522.64 |
| TPC-DS Q71 | 232.54 | 381.90 |
| TPC-DS Q72 | 764.27 | 1377.10 |
| TPC-DS Q73 | 21.83 | 33.57 |
| TPC-DS Q74 | 812.02 | 1388.51 |
| TPC-DS Q75 | 683.78 | 838.65 |
| TPC-DS Q76 | 110.95 | 145.62 |
| TPC-DS Q77 | 248.76 | 386.51 |
| TPC-DS Q78 | 1048.07 | 1373.50 |
| TPC-DS Q79 | 140.20 | 170.78 |
| TPC-DS Q80 | 373.34 | 462.73 |
| TPC-DS Q81 | 33457.40 | 33067.46 |
| TPC-DS Q82 | 253.55 | 342.72 |
| TPC-DS Q83 | 70.71 | 91.81 |
| TPC-DS Q84 | 63.77 | 83.36 |
| TPC-DS Q85 | 245.02 | 335.75 |
| TPC-DS Q86 | 154.42 | 177.32 |
| TPC-DS Q87 | 1069.74 | 1268.70 |
| TPC-DS Q88 | 2007.58 | 2832.92 |
| TPC-DS Q89 | 86.19 | 100.15 |
| TPC-DS Q90 | 91.46 | 103.40 |
| TPC-DS Q91 | 70.78 | 98.15 |
| TPC-DS Q92 | 42.94 | 57.17 |
| TPC-DS Q93 | 136.04 | 164.56 |
| TPC-DS Q94 | 120.59 | 201.13 |
| TPC-DS Q95 | 2736.88 | 2984.67 |
| TPC-DS Q96 | 75.00 | 85.96 |
| TPC-DS Q97 | 287.61 | 334.31 |
| TPC-DS Q98 | 132.56 | 186.74 |
| TPC-DS Q99 | 109.96 | 149.89 |
### Errors (failed queries)
No errors
### Warnings (result mismatch)
| | TPC-DS Q1 | TPC-DS Q2 | TPC-DS Q3 | TPC-DS Q4 | TPC-DS Q5 | TPC-DS Q6 | TPC-DS Q7 | TPC-DS Q8 | TPC-DS Q9 | TPC-DS Q10 | TPC-DS Q11 | TPC-DS Q12 | TPC-DS Q13 | TPC-DS Q14a+b | TPC-DS Q15 | TPC-DS Q16 | TPC-DS Q17 | TPC-DS Q18 | TPC-DS Q19 | TPC-DS Q20 | TPC-DS Q21 | TPC-DS Q22 | TPC-DS Q23a+b | TPC-DS Q24a+b | TPC-DS Q25 | TPC-DS Q26 | TPC-DS Q27 | TPC-DS Q28 | TPC-DS Q29 | TPC-DS Q30 | TPC-DS Q31 | TPC-DS Q32 | TPC-DS Q33 | TPC-DS Q34 | TPC-DS Q35 | TPC-DS Q36 | TPC-DS Q37 | TPC-DS Q38 | TPC-DS Q39a+b | TPC-DS Q40 | TPC-DS Q41 | TPC-DS Q42 | TPC-DS Q43 | TPC-DS Q44 | TPC-DS Q45 | TPC-DS Q46 | TPC-DS Q47 | TPC-DS Q48 | TPC-DS Q49 | TPC-DS Q50 | TPC-DS Q51 | TPC-DS Q52 | TPC-DS Q53 | TPC-DS Q54 | TPC-DS Q55 | TPC-DS Q56 | TPC-DS Q57 | TPC-DS Q58 | TPC-DS Q59 | TPC-DS Q60 | TPC-DS Q61 | TPC-DS Q62 | TPC-DS Q63 | TPC-DS Q64 | TPC-DS Q65 | TPC-DS Q66 | TPC-DS Q67 | TPC-DS Q68 | TPC-DS Q69 | TPC-DS Q70 | TPC-DS Q71 | TPC-DS Q72 | TPC-DS Q73 | TPC-DS Q74 | TPC-DS Q75 | TPC-DS Q76 | TPC-DS Q77 | TPC-DS Q78 | TPC-DS Q79 | TPC-DS Q80 | TPC-DS Q81 | TPC-DS Q82 | TPC-DS Q83 | TPC-DS Q84 | TPC-DS Q85 | TPC-DS Q86 | TPC-DS Q87 | TPC-DS Q88 | TPC-DS Q89 | TPC-DS Q90 | TPC-DS Q91 | TPC-DS Q92 | TPC-DS Q93 | TPC-DS Q94 | TPC-DS Q95 | TPC-DS Q96 | TPC-DS Q97 | TPC-DS Q98 | TPC-DS Q99 |
|:---------------------|------------:|------------:|------------:|------------:|------------:|------------:|------------:|------------:|------------:|-------------:|-------------:|-------------:|-------------:|----------------:|-------------:|-------------:|-------------:|-------------:|-------------:|-------------:|-------------:|-------------:|----------------:|----------------:|-------------:|-------------:|-------------:|-------------:|-------------:|-------------:|-------------:|-------------:|-------------:|-------------:|-------------:|-------------:|-------------:|-------------:|----------------:|-------------:|-------------:|-------------:|-------------:|-------------:|-------------:|-------------:|-------------:|-------------:|-------------:|-------------:|-------------:|-------------:|-------------:|-------------:|-------------:|-------------:|-------------:|-------------:|-------------:|-------------:|-------------:|-------------:|-------------:|-------------:|-------------:|-------------:|-------------:|-------------:|-------------:|-------------:|-------------:|-------------:|-------------:|-------------:|-------------:|-------------:|-------------:|-------------:|-------------:|-------------:|-------------:|-------------:|-------------:|-------------:|-------------:|-------------:|-------------:|-------------:|-------------:|-------------:|-------------:|-------------:|-------------:|-------------:|-------------:|-------------:|-------------:|-------------:|-------------:|
| PostgreSQL-1-2-1-1-1 | 0.00 | 0.00 | 0.00 | 0.00 | 0.00 | 0.00 | 0.00 | 0.00 | 0.00 | 0.00 | 0.00 | 0.00 | 0.00 | 0.00 | 0.00 | 0.00 | 0.00 | 0.00 | 0.00 | 0.00 | 0.00 | 0.00 | 0.00 | 0.00 | 0.00 | 0.00 | 0.00 | 0.00 | 0.00 | 0.00 | 0.00 | 0.00 | 0.00 | 0.00 | 0.00 | 0.00 | 0.00 | 0.00 | 1.00 | 0.00 | 0.00 | 0.00 | 0.00 | 0.00 | 0.00 | 0.00 | 0.00 | 0.00 | 0.00 | 0.00 | 0.00 | 0.00 | 0.00 | 0.00 | 0.00 | 0.00 | 0.00 | 0.00 | 0.00 | 0.00 | 0.00 | 0.00 | 0.00 | 0.00 | 0.00 | 0.00 | 0.00 | 0.00 | 0.00 | 0.00 | 0.00 | 0.00 | 0.00 | 0.00 | 0.00 | 0.00 | 0.00 | 0.00 | 0.00 | 0.00 | 0.00 | 0.00 | 0.00 | 0.00 | 0.00 | 0.00 | 0.00 | 0.00 | 0.00 | 0.00 | 0.00 | 0.00 | 0.00 | 0.00 | 0.00 | 0.00 | 0.00 | 0.00 | 0.00 |
### Tests
* TEST passed: No SUT container restarts
* TEST passed: Geo Times [s] contains no 0 or NaN
* TEST passed: Power@Size [~Q/h] contains no 0 or NaN
* TEST passed: Throughput@Size contains no 0 or NaN
* TEST passed: No SQL errors
* TEST failed: SQL warnings (result mismatch)
* TEST passed: Workflow as planned
The loading times for both instances of loading are the same, since both relate to the same process of ingesting into the database.
Note the added section about volume_size and volume_used in the connections section.
Profiling Benchmark
We have included a custom data profiling benchmark as in [1].
We differentiate between metric attributes (INTEGER, DOUBLE, DECIMAL) and nominal attributes (others). We seek to obtain basic statistics about the attributes and we use COUNT, COUNT NULL (missing values), COUNT DISTINCT and the distribution: MIN, MAX, truncated AVG of values (metric) or of frequencies (nominal). We query for these 6 statistics per attribute and this yields 429 profiling queries.
In [1] the benchmark is used to assess node stability and to compare performance of DBMS and cloud providers.
[1] Orchestrating DBMS Benchmarking in the Cloud with Kubernetes
Erdelt P.K. (2022) Orchestrating DBMS Benchmarking in the Cloud with Kubernetes. In: Nambiar R., Poess M. (eds) Performance Evaluation and Benchmarking. TPCTC 2021. Lecture Notes in Computer Science, vol 13169. Springer, Cham. https://doi.org/10.1007/978-3-030-94437-7_6
Here, we run it at TPC-DS SF=10 in PostgreSQL:
bexhoma tpcds \
  -dbms PostgreSQL \
  -sf 10 \
  -ne 1,1 \
  -nlp 8 \
  -nlt 8 \
  -xii -xic -xis \
  -xdt \
  -m \
  -mc \
  -ms $BEXHOMA_MS \
  -tr \
  -lr 64Gi \
  -rr 64Gi \
  -rss 50Gi \
  -rst $BEXHOMA_STORAGE_CLASS \
  -rnn $BEXHOMA_NODE_SUT -rnl $BEXHOMA_NODE_LOAD -rnb $BEXHOMA_NODE_BENCHMARK \
  profiling &>$LOG_DIR/docs_tpcds_postgresql_profiling.log
Evaluate Results
docs_tpcds_postgresql_profiling.log
## Show Summary

### Workload
TPC-DS Data Profiling SF=10
* Type: tpcds
* Duration: 1511s
* Code: 1783024751
* We compute for all columns: Minimum, maximum, average, count, count distinct, count NULL and non NULL entries and coefficient of variation.
* This experiment compares imported TPC-DS data sets in different DBMS.
  * TPC-DS (SF=10) data is loaded and benchmark is executed.
  * Query ordering is Q1 - Q99.
  * All instances use the same query parameters.
  * Timeout per query is 600.
  * Import sets indexes and constraints after loading and recomputes statistics.
  * Experiment uses bexhoma version 0.10.2.
  * System metrics are monitored by a cluster-wide installation.
  * Experiment is limited to DBMS ['PostgreSQL'].
  * Import is handled by 8 processes (pods).
  * Loading is fixed to cl-worker19.
  * Benchmarking is fixed to cl-worker19.
  * Database is persisted to disk of type shared and size 50Gi.
  * Loading is tested with [8] threads, split into [8] pods.
  * Benchmarking is tested with [1] threads, split into [1] pods.
  * Benchmarking is run as [1, 1] times the number of benchmarking pods.
  * Experiment is run once.

### Connections
* PostgreSQL-1-1-1-1-1 uses docker image postgres:18.3
  * RAM:1081853939712
  * CPU:Intel(R) Xeon(R) Gold 6438Y+
  * Cores:128
  * host:6.8.0-111-generic
  * node:cl-worker37
  * disk:676748
  * volume_size:50G
  * volume_used:50G
  * cpu_list:0-127
  * args:['-c', 'max_connections=640', '-c', 'max_worker_processes=16', '-c', 'max_parallel_workers=16', '-c', 'max_parallel_workers_per_gather=8', '-c', 'max_parallel_maintenance_workers=4', '-c', 'shared_buffers=16GB', '-c', 'effective_cache_size=40GB', '-c', 'work_mem=512MB', '-c', 'maintenance_work_mem=2GB', '-c', 'autovacuum=off', '-c', 'wal_level=minimal', '-c', 'max_wal_senders=0', '-c', 'max_wal_size=32GB', '-c', 'checkpoint_timeout=1h', '-c', 'checkpoint_completion_target=1.0', '-c', 'lock_timeout=30s', '-c', 'idle_in_transaction_session_timeout=30000']
  * requests_cpu:4
  * requests_memory:64Gi
  * limits_memory:64Gi
  * eval_parameters
    * code:1783024751
* PostgreSQL-1-1-2-1-1 uses docker image postgres:18.3
  * RAM:1081853939712
  * CPU:Intel(R) Xeon(R) Gold 6438Y+
  * Cores:128
  * host:6.8.0-111-generic
  * node:cl-worker37
  * disk:676753
  * volume_size:50G
  * volume_used:50G
  * cpu_list:0-127
  * args:['-c', 'max_connections=640', '-c', 'max_worker_processes=16', '-c', 'max_parallel_workers=16', '-c', 'max_parallel_workers_per_gather=8', '-c', 'max_parallel_maintenance_workers=4', '-c', 'shared_buffers=16GB', '-c', 'effective_cache_size=40GB', '-c', 'work_mem=512MB', '-c', 'maintenance_work_mem=2GB', '-c', 'autovacuum=off', '-c', 'wal_level=minimal', '-c', 'max_wal_senders=0', '-c', 'max_wal_size=32GB', '-c', 'checkpoint_timeout=1h', '-c', 'checkpoint_completion_target=1.0', '-c', 'lock_timeout=30s', '-c', 'idle_in_transaction_session_timeout=30000']
  * requests_cpu:4
  * requests_memory:64Gi
  * limits_memory:64Gi
  * eval_parameters
    * code:1783024751

### SUT Container Restarts
* bexhoma-sut-postgresql-1-1783024751-f9968dd55-kw6cv: 0 0

### Workflow

#### Actual

* DBMS PostgreSQL-1 - Experiment 1 Client 1: tpcds (1 pods)
* DBMS PostgreSQL-1 - Experiment 1 Client 2: tpcds (1 pods)

#### Planned

* DBMS PostgreSQL-1 - Experiment 1 Client 1: tpcds (1 pods)
* DBMS PostgreSQL-1 - Experiment 1 Client 2: tpcds (1 pods)

### Loading

#### Per Run

|                |   experiment_run |    SF |   time_load |   time_preload |   time_generate |   time_ingest |   time_postload |   loading_pods |   terminals | tenant_id   | type_tenants   |   num_tenants | vol_tenants   |   Throughput [SF/h] |
|:---------------|-----------------:|------:|------------:|---------------:|----------------:|--------------:|----------------:|---------------:|------------:|:------------|:---------------|--------------:|:--------------|--------------------:|
| PostgreSQL-1-1 |                1 | 10.00 |     1997.00 |           1.00 |            1.00 |        919.00 |         1069.00 |              8 |           0 |             | None           |             0 | False         |               18.03 |

### Execution

#### Per Connection


#### Per Phase


### Latency of Timer Execution [ms]

### Errors (failed queries)

No errors

### Warnings (result mismatch)

No warnings

### Monitoring

### Loading phase: SUT deployment

| DBMS               |   CPU [CPUs] |   Max CPU |   Max RAM [Gb] |   Max RAM Cached [Gb] |
|:-------------------|-------------:|----------:|---------------:|----------------------:|
| PostgreSQL-1-1-1-1 |      1652.96 |      2.19 |          12.84 |                 37.64 |
| PostgreSQL-1-1-2-1 |      1652.96 |      2.19 |          12.84 |                 37.64 |

### Loading phase: component data generator

| DBMS               |   CPU [CPUs] |   Max CPU |   Max RAM [Gb] |   Max RAM Cached [Gb] |
|:-------------------|-------------:|----------:|---------------:|----------------------:|
| PostgreSQL-1-1-1-1 |         0.00 |      0.00 |           0.00 |                  0.00 |
| PostgreSQL-1-1-2-1 |         0.00 |      0.00 |           0.00 |                  0.00 |

### Loading phase: component loader

| DBMS               |   CPU [CPUs] |   Max CPU |   Max RAM [Gb] |   Max RAM Cached [Gb] |
|:-------------------|-------------:|----------:|---------------:|----------------------:|
| PostgreSQL-1-1-1-1 |       139.44 |      0.66 |           0.01 |                  2.82 |
| PostgreSQL-1-1-2-1 |       139.44 |      0.66 |           0.01 |                  2.82 |

### Execution phase: SUT deployment

| DBMS               |   CPU [CPUs] |   Max CPU |   Max RAM [Gb] |   Max RAM Cached [Gb] |
|:-------------------|-------------:|----------:|---------------:|----------------------:|
| PostgreSQL-1-1-1-1 |         0.00 |      0.26 |           3.74 |                 30.20 |
| PostgreSQL-1-1-2-1 |         0.00 |      0.28 |           8.16 |                 40.21 |

### Execution phase: component benchmarker

| DBMS               |   CPU [CPUs] |   Max CPU |   Max RAM [Gb] |   Max RAM Cached [Gb] |
|:-------------------|-------------:|----------:|---------------:|----------------------:|
| PostgreSQL-1-1-1-1 |         0.00 |      0.00 |           0.00 |                  0.00 |
| PostgreSQL-1-1-2-1 |         0.00 |      0.00 |           0.00 |                  0.00 |

### Tests
* TEST passed: No SUT container restarts
* TEST passed: Loading phase: SUT deployment contains no 0 or NaN in CPU [CPUs]
* TEST skipped: Loading phase: component data generator contains 0 or NaN in CPU [CPUs] (data pre-existing)
* TEST passed: Loading phase: component loader contains no 0 or NaN in CPU [CPUs]
* TEST failed: Execution phase: SUT deployment contains 0 or NaN in CPU [CPUs]
* TEST failed: Execution phase: component benchmarker contains 0 or NaN in CPU [CPUs]
* TEST failed: Geo Times [s] contains 0 or NaN
* TEST failed: Power@Size [~Q/h] contains 0 or NaN
* TEST failed: Throughput@Size contains 0 or NaN
* TEST passed: No SQL errors
* TEST passed: No SQL warnings
* TEST passed: Workflow as planned
Example: MonetDB TPC-DS@30
This example shows how to run Q1-Q99 derived from TPC-DS in MonetDB at SF=30. It covers the power and the throughput test. The refresh stream is not included.
The query file is derived from the TPC-DS and as such is not comparable to published TPC-DS results, as the query file results do not comply with the TPC-DS specification.
Official TPC-DS benchmark - http://www.tpc.org/tpcds
The results are not official benchmark results. Exact performance depends on a number of parameters. You may get different results. These examples are solely to illustrate how to use bexhoma and show the result evaluation.
Generate and Load Data
At first we generate TPC-DS data at SF=30 (-sf) with 8 parallel generators (-nlp).
The generated data is stored at the shared disk data.
Moreover the data is loaded into an instance of MonetDB using again 8 parallel loaders.
Afterwards the script creates contraints (-xic) and indexes (-xii) and updates table statistics (-xis).
The database is located in another shared disk of storageClass shared (-rst) and of size 2000Gi (-rss).
Storage is cleaned if it has existed (-rsr).
The script also runs a power test (-ne set to 1) with timeout 14400s (-t) and data transfer activated (-xdt) once (-nc set to 1).
To avoid conflicts with other experiments we set a maximum of 1 DBMS per time (-ms).
Monitoring is activated (-m) for all components (-mc).
A node is requested that has 1024Gi RAM (-rr=request, -lr=limit).
BEXHOMA_NODE_SUT="cl-worker11"
BEXHOMA_NODE_LOAD="cl-worker19"
BEXHOMA_NODE_BENCHMARK="cl-worker19"
LOG_DIR="./logs_tests"
BEXHOMA_MS=1
BEXHOMA_STORAGE_CLASS="shared"

mkdir -p $LOG_DIR

bexhoma tpcds \
  -dbms MonetDB \
  -sf 30 \
  -nc 1 \
  -ne 1 \
  -nlp 8 \
  -nlt 8 \
  -xii -xic -xis \
  -xdt \
  -m \
  -mc \
  -ms $BEXHOMA_MS \
  -t 14400 \
  -lr 1024Gi \
  -rr 1024Gi \
  -rsr \
  -rss 2000Gi \
  -rst $BEXHOMA_STORAGE_CLASS \
  run &>$LOG_DIR/docs_tpcds_monetdb_1.log
Status Database and Benchmark
You can watch the status of experiments via bexhoma status.
In the following example output we see all components of bexhoma are up and running. The cluster stores a MonetDB database corresponding to TPC-DS of SF=30. The disk is of storageClass shared and of size 2000Gi and 156G of that space is used. It took about 4000s to build this database. Currently no DBMS is running.
Dashboard: Running
Message Queue: Running
Data directory: Running
Result directory: Running
Cluster Prometheus: Running
+-----------------------------------------+-----------------+--------------+--------------+-------------------+------------+----------------------+-----------+----------+--------+--------+
| Volumes                                 | configuration   | experiment   | loaded [s]   |   timeLoading [s] | dbms       | storage_class_name   | storage   | status   | size   | used   |
+=========================================+=================+==============+==============+===================+============+======================+===========+==========+========+========+
| bexhoma-storage-monetdb-tpcds-30        | monetdb         | tpcds-30     | True         |              4019 | MonetDB    | shared               | 300Gi     | Bound    | 1000G  | 156G   |
+-----------------------------------------+-----------------+--------------+--------------+-------------------+------------+----------------------+-----------+----------+--------+--------+
Summary of Results
At the end of a benchmark you will see a summary like
docs_tpcds_monetdb_1.log
## Show Summary

### Workload
TPC-DS Queries SF=30
* Type: tpcds
* Duration: 1884s
* Code: 1783005788
* This includes the reading queries of TPC-DS.
* This experiment compares run time and resource consumption of TPC-DS queries in different DBMS.
  * TPC-DS (SF=30) data is loaded and benchmark is executed.
  * Query ordering is Q1 - Q99.
  * All instances use the same query parameters.
  * Timeout per query is 14400.
  * Import sets indexes and constraints after loading and recomputes statistics.
  * Experiment uses bexhoma version 0.10.2.
  * System metrics are monitored by a cluster-wide installation.
  * Experiment is limited to DBMS ['MonetDB'].
  * Import is handled by 8 processes (pods).
  * Database is persisted to disk of type shared and size 2000Gi. Persistent storage is removed at experiment start.
  * Loading is tested with [8] threads, split into [8] pods.
  * Benchmarking is tested with [1] threads, split into [1] pods.
  * Benchmarking is run as [1] times the number of benchmarking pods.
  * Experiment is run once.

### Connections
* MonetDB-1-1-1-1-1 uses docker image monetdb/monetdb:Dec2025-SP1
  * RAM:2164173246464
  * CPU:INTEL(R) XEON(R) PLATINUM 8570
  * Cores:224
  * host:6.8.0-111-generic
  * node:cl-worker36
  * disk:642905
  * volume_size:2.0T
  * volume_used:53G
  * cpu_list:0-223
  * requests_cpu:4
  * requests_memory:1024Gi
  * limits_memory:1024Gi
  * eval_parameters
    * code:1783005788

### SUT Container Restarts
* bexhoma-sut-monetdb-1-1783005788-6674645ddd-nqd6d: 0

### Workflow

#### Actual

* DBMS MonetDB-1 - Experiment 1 Client 1: tpcds (1 pods)

#### Planned

* DBMS MonetDB-1 - Experiment 1 Client 1: tpcds (1 pods)

### Loading

#### Per Run

|             |   experiment_run |    SF |   time_load |   time_preload |   time_generate |   time_ingest |   time_postload |   loading_pods |   terminals | tenant_id   | type_tenants   |   num_tenants | vol_tenants   |   Throughput [SF/h] |
|:------------|-----------------:|------:|------------:|---------------:|----------------:|--------------:|----------------:|---------------:|------------:|:------------|:---------------|--------------:|:--------------|--------------------:|
| MonetDB-1-1 |                1 | 30.00 |     1475.00 |           4.00 |            1.00 |        530.00 |          926.00 |              8 |           0 |             | None           |             0 | False         |               73.22 |

### Execution

#### Per Connection

|                   | configuration   | phase         | job             |   experiment_run |   client |   benchmark_run |   pod_count |    SF |   num_of_queries |   time [s] |   Geo Times [s] |   Power@Size [~Q/h] |   Throughput@Size |   tenant_id | pod               |
|:------------------|:----------------|:--------------|:----------------|-----------------:|---------:|----------------:|------------:|------:|-----------------:|-----------:|----------------:|--------------------:|------------------:|------------:|:------------------|
| MonetDB-1-1-1-1-1 | MonetDB-1       | MonetDB-1-1-1 | MonetDB-1-1-1-1 |                1 |        1 |               1 |           1 | 30.00 |               95 |        732 |            0.68 |           166879.25 |          14016.39 |          -1 | MonetDB-1-1-1-1-1 |

#### Per Phase

|               | phase         |   experiment_run |   client |   benchmark_run |   pod_count |    SF |   num_of_queries |   time [s] |   Geo Times [s] |   Power@Size [~Q/h] |   Throughput@Size |   tenant_id |
|:--------------|:--------------|-----------------:|---------:|----------------:|------------:|------:|-----------------:|-----------:|----------------:|--------------------:|------------------:|------------:|
| MonetDB-1-1-1 | MonetDB-1-1-1 |                1 |        1 |               1 |           1 | 30.00 |               95 |        732 |            0.68 |           166879.25 |          14016.39 |          -1 |

### Latency of Timer Execution [ms]
| Queries       |   MonetDB-1-1-1-1-1 |
|:--------------|--------------------:|
| TPC-DS Q1     |              293.93 |
| TPC-DS Q2     |             1934.26 |
| TPC-DS Q3     |              442.54 |
| TPC-DS Q4     |            16152.60 |
| TPC-DS Q5     |             1368.65 |
| TPC-DS Q6     |              383.03 |
| TPC-DS Q7     |              342.43 |
| TPC-DS Q8     |              306.68 |
| TPC-DS Q9     |              857.80 |
| TPC-DS Q10    |              109.92 |
| TPC-DS Q11    |             6802.43 |
| TPC-DS Q12    |              160.22 |
| TPC-DS Q13    |              496.14 |
| TPC-DS Q14a+b |            34686.66 |
| TPC-DS Q15    |              183.21 |
| TPC-DS Q16    |            40486.93 |
| TPC-DS Q17    |             2397.13 |
| TPC-DS Q18    |              806.73 |
| TPC-DS Q19    |              194.64 |
| TPC-DS Q20    |              143.64 |
| TPC-DS Q21    |              152.05 |
| TPC-DS Q22    |             1069.65 |
| TPC-DS Q23a+b |            53920.76 |
| TPC-DS Q24a+b |            20106.17 |
| TPC-DS Q25    |             2403.08 |
| TPC-DS Q26    |              254.80 |
| TPC-DS Q27    |             1126.26 |
| TPC-DS Q28    |              983.10 |
| TPC-DS Q29    |             2247.58 |
| TPC-DS Q30    |              113.98 |
| TPC-DS Q31    |             2005.23 |
| TPC-DS Q32    |              189.70 |
| TPC-DS Q33    |               93.11 |
| TPC-DS Q34    |              208.59 |
| TPC-DS Q35    |             1015.40 |
| TPC-DS Q36    |             1157.83 |
| TPC-DS Q37    |              515.81 |
| TPC-DS Q38    |             2224.59 |
| TPC-DS Q39a+b |             1307.31 |
| TPC-DS Q40    |              980.92 |
| TPC-DS Q41    |                6.78 |
| TPC-DS Q42    |              132.36 |
| TPC-DS Q43    |              309.21 |
| TPC-DS Q44    |              205.99 |
| TPC-DS Q45    |              156.56 |
| TPC-DS Q46    |              231.80 |
| TPC-DS Q47    |              985.87 |
| TPC-DS Q48    |              230.73 |
| TPC-DS Q49    |             1263.42 |
| TPC-DS Q50    |              611.57 |
| TPC-DS Q51    |             2099.36 |
| TPC-DS Q52    |               75.32 |
| TPC-DS Q53    |               91.36 |
| TPC-DS Q54    |              103.47 |
| TPC-DS Q55    |               96.21 |
| TPC-DS Q56    |              101.52 |
| TPC-DS Q57    |              153.13 |
| TPC-DS Q58    |             5506.27 |
| TPC-DS Q59    |              962.24 |
| TPC-DS Q60    |              117.83 |
| TPC-DS Q61    |              319.80 |
| TPC-DS Q62    |              332.45 |
| TPC-DS Q63    |               87.36 |
| TPC-DS Q64    |             4161.67 |
| TPC-DS Q65    |             1318.94 |
| TPC-DS Q66    |             2011.13 |
| TPC-DS Q67    |             4685.05 |
| TPC-DS Q68    |              532.34 |
| TPC-DS Q69    |               96.04 |
| TPC-DS Q70    |             2206.65 |
| TPC-DS Q71    |              218.54 |
| TPC-DS Q72    |             1231.54 |
| TPC-DS Q73    |               78.67 |
| TPC-DS Q74    |             1864.48 |
| TPC-DS Q75    |             6220.18 |
| TPC-DS Q76    |             1641.90 |
| TPC-DS Q77    |              779.15 |
| TPC-DS Q78    |            11897.88 |
| TPC-DS Q79    |              263.64 |
| TPC-DS Q80    |             7195.21 |
| TPC-DS Q81    |               93.16 |
| TPC-DS Q82    |              482.26 |
| TPC-DS Q83    |               43.09 |
| TPC-DS Q84    |               35.46 |
| TPC-DS Q85    |              912.64 |
| TPC-DS Q86    |              330.66 |
| TPC-DS Q87    |             3183.65 |
| TPC-DS Q88    |              592.07 |
| TPC-DS Q89    |              162.43 |
| TPC-DS Q90    |               94.13 |
| TPC-DS Q91    |               34.80 |
| TPC-DS Q92    |              182.45 |
| TPC-DS Q93    |             1995.47 |
| TPC-DS Q94    |            35202.01 |
| TPC-DS Q95    |           344738.96 |

### Errors (failed queries)

|                   |   TPC-DS Q1 |   TPC-DS Q2 |   TPC-DS Q3 |   TPC-DS Q4 |   TPC-DS Q5 |   TPC-DS Q6 |   TPC-DS Q7 |   TPC-DS Q8 |   TPC-DS Q9 |   TPC-DS Q10 |   TPC-DS Q11 |   TPC-DS Q12 |   TPC-DS Q13 |   TPC-DS Q14a+b |   TPC-DS Q15 |   TPC-DS Q16 |   TPC-DS Q17 |   TPC-DS Q18 |   TPC-DS Q19 |   TPC-DS Q20 |   TPC-DS Q21 |   TPC-DS Q22 |   TPC-DS Q23a+b |   TPC-DS Q24a+b |   TPC-DS Q25 |   TPC-DS Q26 |   TPC-DS Q27 |   TPC-DS Q28 |   TPC-DS Q29 |   TPC-DS Q30 |   TPC-DS Q31 |   TPC-DS Q32 |   TPC-DS Q33 |   TPC-DS Q34 |   TPC-DS Q35 |   TPC-DS Q36 |   TPC-DS Q37 |   TPC-DS Q38 |   TPC-DS Q39a+b |   TPC-DS Q40 |   TPC-DS Q41 |   TPC-DS Q42 |   TPC-DS Q43 |   TPC-DS Q44 |   TPC-DS Q45 |   TPC-DS Q46 |   TPC-DS Q47 |   TPC-DS Q48 |   TPC-DS Q49 |   TPC-DS Q50 |   TPC-DS Q51 |   TPC-DS Q52 |   TPC-DS Q53 |   TPC-DS Q54 |   TPC-DS Q55 |   TPC-DS Q56 |   TPC-DS Q57 |   TPC-DS Q58 |   TPC-DS Q59 |   TPC-DS Q60 |   TPC-DS Q61 |   TPC-DS Q62 |   TPC-DS Q63 |   TPC-DS Q64 |   TPC-DS Q65 |   TPC-DS Q66 |   TPC-DS Q67 |   TPC-DS Q68 |   TPC-DS Q69 |   TPC-DS Q70 |   TPC-DS Q71 |   TPC-DS Q72 |   TPC-DS Q73 |   TPC-DS Q74 |   TPC-DS Q75 |   TPC-DS Q76 |   TPC-DS Q77 |   TPC-DS Q78 |   TPC-DS Q79 |   TPC-DS Q80 |   TPC-DS Q81 |   TPC-DS Q82 |   TPC-DS Q83 |   TPC-DS Q84 |   TPC-DS Q85 |   TPC-DS Q86 |   TPC-DS Q87 |   TPC-DS Q88 |   TPC-DS Q89 |   TPC-DS Q90 |   TPC-DS Q91 |   TPC-DS Q92 |   TPC-DS Q93 |   TPC-DS Q94 |   TPC-DS Q95 |   TPC-DS Q96 |   TPC-DS Q97 |   TPC-DS Q98 |   TPC-DS Q99 |
|:------------------|------------:|------------:|------------:|------------:|------------:|------------:|------------:|------------:|------------:|-------------:|-------------:|-------------:|-------------:|----------------:|-------------:|-------------:|-------------:|-------------:|-------------:|-------------:|-------------:|-------------:|----------------:|----------------:|-------------:|-------------:|-------------:|-------------:|-------------:|-------------:|-------------:|-------------:|-------------:|-------------:|-------------:|-------------:|-------------:|-------------:|----------------:|-------------:|-------------:|-------------:|-------------:|-------------:|-------------:|-------------:|-------------:|-------------:|-------------:|-------------:|-------------:|-------------:|-------------:|-------------:|-------------:|-------------:|-------------:|-------------:|-------------:|-------------:|-------------:|-------------:|-------------:|-------------:|-------------:|-------------:|-------------:|-------------:|-------------:|-------------:|-------------:|-------------:|-------------:|-------------:|-------------:|-------------:|-------------:|-------------:|-------------:|-------------:|-------------:|-------------:|-------------:|-------------:|-------------:|-------------:|-------------:|-------------:|-------------:|-------------:|-------------:|-------------:|-------------:|-------------:|-------------:|-------------:|-------------:|-------------:|-------------:|
| MonetDB-1-1-1-1-1 |        0.00 |        0.00 |        0.00 |        0.00 |        0.00 |        0.00 |        0.00 |        0.00 |        0.00 |         0.00 |         0.00 |         0.00 |         0.00 |            0.00 |         0.00 |         0.00 |         0.00 |         0.00 |         0.00 |         0.00 |         0.00 |         0.00 |            0.00 |            0.00 |         0.00 |         0.00 |         0.00 |         0.00 |         0.00 |         0.00 |         0.00 |         0.00 |         0.00 |         0.00 |         0.00 |         0.00 |         0.00 |         0.00 |            0.00 |         0.00 |         0.00 |         0.00 |         0.00 |         0.00 |         0.00 |         0.00 |         0.00 |         0.00 |         0.00 |         0.00 |         0.00 |         0.00 |         0.00 |         0.00 |         0.00 |         0.00 |         0.00 |         0.00 |         0.00 |         0.00 |         0.00 |         0.00 |         0.00 |         0.00 |         0.00 |         0.00 |         0.00 |         0.00 |         0.00 |         0.00 |         0.00 |         0.00 |         0.00 |         0.00 |         0.00 |         0.00 |         0.00 |         0.00 |         0.00 |         0.00 |         0.00 |         0.00 |         0.00 |         0.00 |         0.00 |         0.00 |         0.00 |         0.00 |         0.00 |         0.00 |         0.00 |         0.00 |         0.00 |         0.00 |         0.00 |         1.00 |         1.00 |         1.00 |         1.00 |
* TPC-DS Q96
  * MonetDB-1-1-1-1-1: numRun 1: : java.sql.SQLException: Cannot bind column sys.store_sales.ss_sold_time_sk
* TPC-DS Q97
  * MonetDB-1-1-1-1-1: numRun 1: : java.sql.SQLException: Cannot bind column sys.store_sales.ss_sold_date_sk
* TPC-DS Q98
  * MonetDB-1-1-1-1-1: numRun 1: : java.sql.SQLException: Cannot bind column sys.store_sales.ss_item_sk
* TPC-DS Q99
  * MonetDB-1-1-1-1-1: numRun 1: : java.sql.SQLException: Cannot bind column sys.catalog_sales.cs_call_center_sk

### Warnings (result mismatch)

No warnings

### Monitoring

### Loading phase: SUT deployment

| DBMS            |   CPU [CPUs] |   Max CPU |   Max RAM [Gb] |   Max RAM Cached [Gb] |
|:----------------|-------------:|----------:|---------------:|----------------------:|
| MonetDB-1-1-1-1 |      2280.32 |      5.36 |          52.75 |                 53.46 |

### Loading phase: component data generator

| DBMS            |   CPU [CPUs] |   Max CPU |   Max RAM [Gb] |   Max RAM Cached [Gb] |
|:----------------|-------------:|----------:|---------------:|----------------------:|
| MonetDB-1-1-1-1 |         0.00 |      0.00 |           0.00 |                  0.00 |

### Loading phase: component loader

| DBMS            |   CPU [CPUs] |   Max CPU |   Max RAM [Gb] |   Max RAM Cached [Gb] |
|:----------------|-------------:|----------:|---------------:|----------------------:|
| MonetDB-1-1-1-1 |       462.46 |      1.11 |           0.01 |                  3.36 |

### Execution phase: SUT deployment

| DBMS            |   CPU [CPUs] |   Max CPU |   Max RAM [Gb] |   Max RAM Cached [Gb] |
|:----------------|-------------:|----------:|---------------:|----------------------:|
| MonetDB-1-1-1-1 |     11251.02 |    173.16 |         826.52 |                826.53 |

### Execution phase: component benchmarker

| DBMS            |   CPU [CPUs] |   Max CPU |   Max RAM [Gb] |   Max RAM Cached [Gb] |
|:----------------|-------------:|----------:|---------------:|----------------------:|
| MonetDB-1-1-1-1 |        87.84 |      0.63 |           0.64 |                  0.67 |

### Tests
* TEST passed: No SUT container restarts
* TEST passed: Loading phase: SUT deployment contains no 0 or NaN in CPU [CPUs]
* TEST skipped: Loading phase: component data generator contains 0 or NaN in CPU [CPUs] (data pre-existing)
* TEST passed: Loading phase: component loader contains no 0 or NaN in CPU [CPUs]
* TEST passed: Execution phase: SUT deployment contains no 0 or NaN in CPU [CPUs]
* TEST passed: Execution phase: component benchmarker contains no 0 or NaN in CPU [CPUs]
* TEST passed: Geo Times [s] contains no 0 or NaN
* TEST passed: Power@Size [~Q/h] contains no 0 or NaN
* TEST passed: Throughput@Size contains no 0 or NaN
* TEST failed: SQL errors
* TEST passed: No SQL warnings
* TEST passed: Workflow as planned
Perform Benchmark - Power Test
We now start a new instance of MonetDB and mount the existing database: we use the prepared database on the shared disk.
We then run two power tests, one after the other (-ne 1,1), and shut down the DBMS.
This is repeated 2 times (-nc).
bexhoma tpcds \
  -dbms MonetDB \
  -sf 30 \
  -nc 2 \
  -ne 1,1 \
  -nlp 8 \
  -nlt 8 \
  -xii -xic -xis \
  -xdt \
  -m \
  -mc \
  -ms $BEXHOMA_MS \
  -t 14400 \
  -lr 1024Gi \
  -rr 1024Gi \
  -rss 2000Gi \
  -rst $BEXHOMA_STORAGE_CLASS \
  run &>$LOG_DIR/docs_tpcds_monetdb_2.log
Evaluate Results
docs_tpcds_monetdb_2.log
## Show Summary
### Workload
TPC-DS Queries SF=30
Type: tpcds
Duration: 2276s
Code: 1772479408
This includes the reading queries of TPC-DS.
This experiment compares run time and resource consumption of TPC-DS queries in different DBMS.
TPC-DS (SF=30) data is loaded and benchmark is executed.
Query ordering is Q1 - Q99.
All instances use the same query parameters.
Timeout per query is 14400.
Import sets indexes and constraints after loading and recomputes statistics.
Experiment uses bexhoma version 0.8.21.
System metrics are monitored by a cluster-wide installation.
Experiment is limited to DBMS ['MonetDB'].
Import is handled by 8 processes (pods).
Database is persisted to disk of type shared and size 1000Gi.
Loading is tested with [8] threads, split into [8] pods.
Benchmarking is tested with [1] threads, split into [1] pods.
Benchmarking is run as [1, 1] times the number of benchmarking pods.
Experiment is run 2 times.
### Connections
MonetDB-BHT-8-1-1-1 uses docker image monetdb/monetdb:Dec2025
RAM:2164173176832
CPU:INTEL(R) XEON(R) PLATINUM 8570
Cores:224
host:6.8.0-90-generic
node:cl-worker36
disk:1191991
volume_size:1000G
volume_used:75G
cpu_list:0-223
requests_cpu:4
requests_memory:1024Gi
limits_memory:1024Gi
eval_parameters
code:1772479408
MonetDB-BHT-8-1-2-1 uses docker image monetdb/monetdb:Dec2025
RAM:2164173176832
CPU:INTEL(R) XEON(R) PLATINUM 8570
Cores:224
host:6.8.0-90-generic
node:cl-worker36
disk:1191993
volume_size:1000G
volume_used:75G
cpu_list:0-223
requests_cpu:4
requests_memory:1024Gi
limits_memory:1024Gi
eval_parameters
code:1772479408
MonetDB-BHT-8-2-1-1 uses docker image monetdb/monetdb:Dec2025
RAM:2164173176832
CPU:INTEL(R) XEON(R) PLATINUM 8570
Cores:224
host:6.8.0-90-generic
node:cl-worker36
disk:1191985
volume_size:1000G
volume_used:74G
cpu_list:0-223
requests_cpu:4
requests_memory:1024Gi
limits_memory:1024Gi
eval_parameters
code:1772479408
MonetDB-BHT-8-2-2-1 uses docker image monetdb/monetdb:Dec2025
RAM:2164173176832
CPU:INTEL(R) XEON(R) PLATINUM 8570
Cores:224
host:6.8.0-90-generic
node:cl-worker36
disk:1191988
volume_size:1000G
volume_used:74G
cpu_list:0-223
requests_cpu:4
requests_memory:1024Gi
limits_memory:1024Gi
eval_parameters
code:1772479408
### Errors (failed queries)
MonetDB-BHT-8-1-1-1 MonetDB-BHT-8-1-2-1 MonetDB-BHT-8-2-1-1 MonetDB-BHT-8-2-2-1
TPC-DS Q90 True True True True
TPC-DS Q90
MonetDB-BHT-8-1-2-1: numRun 1: : java.sql.SQLException: division by zero.
MonetDB-BHT-8-2-2-1: numRun 1: : java.sql.SQLException: division by zero.
MonetDB-BHT-8-1-1-1: numRun 1: : java.sql.SQLException: division by zero.
MonetDB-BHT-8-2-1-1: numRun 1: : java.sql.SQLException: division by zero.
### Warnings (result mismatch)
MonetDB-BHT-8-1-1-1 MonetDB-BHT-8-1-2-1 MonetDB-BHT-8-2-1-1 MonetDB-BHT-8-2-2-1
TPC-DS Q39a+b True False True True
### Latency of Timer Execution [ms]
DBMS MonetDB-BHT-8-1-1-1 MonetDB-BHT-8-1-2-1 MonetDB-BHT-8-2-1-1 MonetDB-BHT-8-2-2-1
TPC-DS Q1 2826.56 62.55 2512.90 65.91
TPC-DS Q2 8435.85 217.23 7983.39 205.07
TPC-DS Q3 19638.00 308.97 17956.18 318.85
TPC-DS Q4 48656.34 4318.13 47250.61 4069.01
TPC-DS Q5 61212.16 1307.72 62282.62 1303.80
TPC-DS Q6 1191.94 545.45 1251.95 356.28
TPC-DS Q7 34696.43 129.74 33854.55 152.15
TPC-DS Q8 419.65 13.26 199.14 11.30
TPC-DS Q9 1017.37 733.66 949.91 645.32
TPC-DS Q10 115826.34 50.80 115181.32 52.48
TPC-DS Q11 2369.69 1800.28 2334.08 1581.88
TPC-DS Q12 284.16 129.29 353.36 131.39
TPC-DS Q13 393.37 255.94 381.72 265.08
TPC-DS Q14a+b 61.98 38.42 53.15 26.46
TPC-DS Q15 126.07 138.27 115.81 133.59
TPC-DS Q16 50886.81 39387.54 50040.85 39240.87
TPC-DS Q17 12354.78 2230.10 12322.87 2291.14
TPC-DS Q18 3756.94 512.79 4039.04 566.11
TPC-DS Q19 359.42 175.92 277.55 173.71
TPC-DS Q20 122.11 98.86 135.08 128.17
TPC-DS Q21 7585.90 108.21 7721.92 119.27
TPC-DS Q22 2596.31 244.49 2431.62 344.44
TPC-DS Q23a+b 935.17 629.97 1031.56 644.73
TPC-DS Q24a+b 3390.77 3167.91 3801.41 3172.05
TPC-DS Q25 838.72 660.20 746.02 669.47
TPC-DS Q26 140.51 136.72 146.48 165.09
TPC-DS Q27 6635.07 867.54 7005.99 861.01
TPC-DS Q28 1834.76 1026.56 1796.13 1069.73
TPC-DS Q29 731.26 683.28 816.55 675.38
TPC-DS Q30 219.34 18.40 174.29 32.38
TPC-DS Q31 2665.72 1214.38 2557.54 1163.32
TPC-DS Q32 153.25 137.98 138.89 130.84
TPC-DS Q33 329.03 78.56 144.57 80.47
TPC-DS Q34 2003.90 335.00 1667.71 337.43
TPC-DS Q35 33.18 28.02 35.80 27.13
TPC-DS Q36 784.55 753.23 730.25 729.42
TPC-DS Q37 461.13 511.49 435.50 344.97
TPC-DS Q38 5.61 6.06 5.37 5.29
TPC-DS Q39a+b 12.90 10.01 9.03 8.97
TPC-DS Q40 1696.95 498.46 2194.12 547.27
TPC-DS Q41 6.09 5.64 6.07 5.23
TPC-DS Q42 91.93 69.45 92.81 74.36
TPC-DS Q43 266.83 231.77 302.81 257.88
TPC-DS Q44 245.38 246.25 270.45 227.70
TPC-DS Q45 193.67 136.94 170.82 144.34
TPC-DS Q46 302.86 193.60 269.31 192.79
TPC-DS Q47 232.44 142.66 242.17 139.36
TPC-DS Q48 164.19 167.37 168.61 167.43
TPC-DS Q49 7430.78 949.56 7459.57 1012.68
TPC-DS Q50 781.49 619.02 865.88 629.30
TPC-DS Q51 94.30 116.72 103.25 90.37
TPC-DS Q52 64.41 61.23 64.51 63.13
TPC-DS Q53 123.76 85.27 98.40 89.21
TPC-DS Q54 2030.80 151.17 2157.87 148.46
TPC-DS Q55 71.84 64.50 70.98 50.32
TPC-DS Q56 1598.46 1633.47 1668.59 1641.33
TPC-DS Q57 218.59 117.96 209.82 116.57
TPC-DS Q58 1374.24 427.65 1533.40 454.38
TPC-DS Q59 914.30 812.16 927.35 822.67
TPC-DS Q60 3039.10 3060.70 3033.69 3070.00
TPC-DS Q61 241.43 177.60 235.55 190.22
TPC-DS Q62 378.38 252.87 339.74 254.04
TPC-DS Q63 151.45 102.17 118.79 108.03
TPC-DS Q64 10251.22 2252.86 10200.66 2163.83
TPC-DS Q65 194.27 205.60 184.99 209.12
TPC-DS Q66 1642.17 1417.15 1769.73 1415.39
TPC-DS Q67 16.96 17.03 16.83 16.22
TPC-DS Q68 256.01 325.09 263.94 277.61
TPC-DS Q69 35.85 34.39 37.04 35.10
TPC-DS Q70 381.16 11.87 435.16 11.61
TPC-DS Q71 176.05 126.83 189.09 128.07
TPC-DS Q72 1587.83 629.29 1446.11 646.11
TPC-DS Q73 94.93 86.82 79.04 79.75
TPC-DS Q74 552.13 499.24 535.68 458.69
TPC-DS Q75 5659.66 3224.52 5847.85 3236.84
TPC-DS Q76 21541.68 6118.99 21848.77 5005.27
TPC-DS Q77 724.31 502.99 851.97 571.36
TPC-DS Q78 6986.43 2815.09 7061.53 3056.98
TPC-DS Q79 177.69 150.95 149.61 150.41
TPC-DS Q80 6015.40 5942.31 6175.09 5950.51
TPC-DS Q81 211.11 24.02 123.87 22.17
TPC-DS Q82 484.13 401.15 467.56 501.44
TPC-DS Q83 20.68 23.56 21.20 20.59
TPC-DS Q84 114.92 37.32 62.61 24.08
TPC-DS Q85 424.98 375.37 430.98 397.02
TPC-DS Q86 166.25 250.17 157.58 239.26
TPC-DS Q87 16.24 8.34 7.67 6.71
TPC-DS Q88 731.94 657.34 707.60 665.00
TPC-DS Q89 179.08 188.31 173.58 153.14
TPC-DS Q91 247.89 29.74 201.08 26.64
TPC-DS Q92 123.74 136.88 135.54 136.20
TPC-DS Q93 1919.05 1879.40 1910.63 1891.93
TPC-DS Q94 35739.82 35444.00 35666.21 32985.20
TPC-DS Q95 36990.16 34054.68 33622.06 36310.39
TPC-DS Q96 35.80 36.00 36.09 34.71
TPC-DS Q97 62.38 50.63 65.17 44.29
TPC-DS Q98 131.69 128.08 125.96 101.95
TPC-DS Q99 267.73 267.17 280.21 268.54
### Loading [s]
timeGenerate timeIngesting timeSchema timeIndex timeLoad
MonetDB-BHT-8-1-1-1 1.0 257.0 11.0 1070.0 1376.0
MonetDB-BHT-8-1-2-1 1.0 257.0 11.0 1070.0 1376.0
MonetDB-BHT-8-2-1-1 1.0 257.0 11.0 1070.0 1376.0
MonetDB-BHT-8-2-2-1 1.0 257.0 11.0 1070.0 1376.0
### Geometric Mean of Medians of Timer Run [s]
Geo Times [s]
DBMS
MonetDB-BHT-8-1-1-1 0.61
MonetDB-BHT-8-1-2-1 0.25
MonetDB-BHT-8-2-1-1 0.58
MonetDB-BHT-8-2-2-1 0.25
### Power@Size ((3600*SF)/(geo times))
Power@Size [~Q/h]
DBMS
MonetDB-BHT-8-1-1-1 176269.76
MonetDB-BHT-8-1-2-1 425439.59
MonetDB-BHT-8-2-1-1 185272.31
MonetDB-BHT-8-2-2-1 433826.07
### Throughput@Size ((runs*queries*streams*3600*SF)/(span of time))
time [s] count SF Throughput@Size
DBMS SF num_experiment num_client
MonetDB-BHT-8-1-1 30.0 1 1 566 1 30.0 18699.65
MonetDB-BHT-8-1-2 30.0 1 2 177 1 30.0 59796.61
MonetDB-BHT-8-2-1 30.0 2 1 561 1 30.0 18866.31
MonetDB-BHT-8-2-2 30.0 2 2 178 1 30.0 59460.67
### Workflow
orig_name SF pods num_experiment num_client benchmark_start benchmark_end
MonetDB-BHT-8-1-1-1 MonetDB-BHT-8-1-1 30.0 8 1 1 1772479577 1772480143
MonetDB-BHT-8-1-2-1 MonetDB-BHT-8-1-2 30.0 8 1 2 1772480273 1772480450
MonetDB-BHT-8-2-1-1 MonetDB-BHT-8-2-1 30.0 8 2 1 1772480734 1772481295
MonetDB-BHT-8-2-2-1 MonetDB-BHT-8-2-2 30.0 8 2 2 1772481429 1772481607
#### Actual
DBMS MonetDB-BHT-8 - Pods [[1, 1], [1, 1]]
#### Planned
DBMS MonetDB-BHT-8 - Pods [[1, 1], [1, 1]]
### Execution - SUT
CPU [CPUs] Max CPU Max RAM [Gb] Max RAM Cached [Gb]
MonetDB-BHT-8-1-1 2985.66 16.74 42.76 42.83
MonetDB-BHT-8-1-2 2504.62 18.74 49.43 49.52
MonetDB-BHT-8-2-1 12931.64 15.30 46.08 46.16
MonetDB-BHT-8-2-2 2366.11 20.23 46.50 46.58
### Execution - Benchmarker
CPU [CPUs] Max CPU Max RAM [Gb] Max RAM Cached [Gb]
MonetDB-BHT-8-1-1 13.59 0.20 0.32 0.33
MonetDB-BHT-8-1-2 13.59 0.01 0.32 0.33
MonetDB-BHT-8-2-1 15.11 0.02 0.30 0.31
MonetDB-BHT-8-2-2 15.11 0.18 0.30 0.31
### Tests
TEST passed: Geo Times [s] contains no 0 or NaN
TEST passed: Power@Size [~Q/h] contains no 0 or NaN
TEST passed: Throughput@Size contains no 0 or NaN
TEST failed: SQL errors
TEST failed: SQL warnings (result mismatch)
TEST passed: Workflow as planned
TEST passed: Execution SUT contains no 0 or NaN in CPU [CPUs]
TEST passed: Execution Benchmarker contains no 0 or NaN in CPU [CPUs]
Perform Benchmark - Throughput Test
We now start a new instance of MonetDB and mount the existing database: we use the prepared database on the shared disk.
We then run two power tests, one after the other, and then a throughput test with 3 parallel driver (-ne 1,1,3). and shut down the DBMS.
bexhoma tpcds \
  -dbms MonetDB \
  -sf 30 \
  -nc 1 \
  -ne 1,1,3 \
  -nlp 8 \
  -nlt 8 \
  -xii -xic -xis \
  -xdt \
  -m \
  -mc \
  -ms $BEXHOMA_MS \
  -t 14400 \
  -lr 1024Gi \
  -rr 1024Gi \
  -rss 2000Gi \
  -rst $BEXHOMA_STORAGE_CLASS \
  run &>$LOG_DIR/docs_tpcds_monetdb_3.log
Evaluate Results
docs_tpcds_monetdb_3.log
## Show Summary
### Workload
TPC-DS Queries SF=30
Type: tpcds
Duration: 1771s
Code: 1772481803
This includes the reading queries of TPC-DS.
This experiment compares run time and resource consumption of TPC-DS queries in different DBMS.
TPC-DS (SF=30) data is loaded and benchmark is executed.
Query ordering is Q1 - Q99.
All instances use the same query parameters.
Timeout per query is 14400.
Import sets indexes and constraints after loading and recomputes statistics.
Experiment uses bexhoma version 0.8.21.
System metrics are monitored by a cluster-wide installation.
Experiment is limited to DBMS ['MonetDB'].
Import is handled by 8 processes (pods).
Database is persisted to disk of type shared and size 1000Gi.
Loading is tested with [8] threads, split into [8] pods.
Benchmarking is tested with [1] threads, split into [1] pods.
Benchmarking is run as [1, 1, 3] times the number of benchmarking pods.
Experiment is run once.
### Connections
MonetDB-BHT-8-1-1 uses docker image monetdb/monetdb:Dec2025
RAM:2164173176832
CPU:INTEL(R) XEON(R) PLATINUM 8570
Cores:224
host:6.8.0-90-generic
node:cl-worker36
disk:1191989
volume_size:1000G
volume_used:74G
cpu_list:0-223
requests_cpu:4
requests_memory:1024Gi
limits_memory:1024Gi
eval_parameters
code:1772481803
MonetDB-BHT-8-2-1 uses docker image monetdb/monetdb:Dec2025
RAM:2164173176832
CPU:INTEL(R) XEON(R) PLATINUM 8570
Cores:224
host:6.8.0-90-generic
node:cl-worker36
disk:1191974
volume_size:1000G
volume_used:74G
cpu_list:0-223
requests_cpu:4
requests_memory:1024Gi
limits_memory:1024Gi
eval_parameters
code:1772481803
MonetDB-BHT-8-3-1 uses docker image monetdb/monetdb:Dec2025
RAM:2164173176832
CPU:INTEL(R) XEON(R) PLATINUM 8570
Cores:224
host:6.8.0-90-generic
node:cl-worker36
disk:1191977
volume_size:1000G
volume_used:74G
cpu_list:0-223
requests_cpu:4
requests_memory:1024Gi
limits_memory:1024Gi
eval_parameters
code:1772481803
MonetDB-BHT-8-3-2 uses docker image monetdb/monetdb:Dec2025
RAM:2164173176832
CPU:INTEL(R) XEON(R) PLATINUM 8570
Cores:224
host:6.8.0-90-generic
node:cl-worker36
disk:1191977
volume_size:1000G
volume_used:74G
cpu_list:0-223
requests_cpu:4
requests_memory:1024Gi
limits_memory:1024Gi
eval_parameters
code:1772481803
MonetDB-BHT-8-3-3 uses docker image monetdb/monetdb:Dec2025
RAM:2164173176832
CPU:INTEL(R) XEON(R) PLATINUM 8570
Cores:224
host:6.8.0-90-generic
node:cl-worker36
disk:1191977
volume_size:1000G
volume_used:74G
cpu_list:0-223
requests_cpu:4
requests_memory:1024Gi
limits_memory:1024Gi
eval_parameters
code:1772481803
### Errors (failed queries)
MonetDB-BHT-8-1-1 MonetDB-BHT-8-2-1 MonetDB-BHT-8-3-1 MonetDB-BHT-8-3-2 MonetDB-BHT-8-3-3
TPC-DS Q90 True True True True True
TPC-DS Q90
MonetDB-BHT-8-3-2: numRun 1: : java.sql.SQLException: division by zero.
MonetDB-BHT-8-3-3: numRun 1: : java.sql.SQLException: division by zero.
MonetDB-BHT-8-1-1: numRun 1: : java.sql.SQLException: division by zero.
MonetDB-BHT-8-2-1: numRun 1: : java.sql.SQLException: division by zero.
MonetDB-BHT-8-3-1: numRun 1: : java.sql.SQLException: division by zero.
### Warnings (result mismatch)
MonetDB-BHT-8-1-1 MonetDB-BHT-8-2-1 MonetDB-BHT-8-3-1 MonetDB-BHT-8-3-2 MonetDB-BHT-8-3-3
TPC-DS Q39a+b True True True False True
### Latency of Timer Execution [ms]
DBMS MonetDB-BHT-8-1-1 MonetDB-BHT-8-2-1 MonetDB-BHT-8-3-1 MonetDB-BHT-8-3-2 MonetDB-BHT-8-3-3
TPC-DS Q1 2803.58 69.71 73.52 53.87 57.44
TPC-DS Q2 8636.28 217.20 483.02 227.28 380.94
TPC-DS Q3 19256.43 359.37 102.71 567.71 532.36
TPC-DS Q4 47404.68 4054.92 6772.10 7032.01 7949.06
TPC-DS Q5 63149.32 2945.17 1588.82 1526.41 1487.74
TPC-DS Q6 1134.22 567.84 871.56 768.15 246.80
TPC-DS Q7 33931.77 127.99 159.69 212.03 159.79
TPC-DS Q8 302.24 12.71 16.17 13.35 13.43
TPC-DS Q9 6324.16 686.99 1364.37 1530.11 1122.17
TPC-DS Q10 114502.85 47.49 33.14 40.01 121.52
TPC-DS Q11 2380.92 1644.09 2159.83 2667.66 2052.77
TPC-DS Q12 275.96 106.42 239.59 227.31 238.17
TPC-DS Q13 388.99 258.05 435.11 288.15 212.08
TPC-DS Q14a+b 75.95 27.79 25.32 25.43 28.13
TPC-DS Q15 117.27 129.62 138.21 133.06 120.35
TPC-DS Q16 49963.68 37998.73 112920.96 37736.07 65578.99
TPC-DS Q17 12802.24 2308.06 4348.07 2677.53 4326.35
TPC-DS Q18 4766.91 525.50 935.86 2412.95 16190.55
TPC-DS Q19 306.45 173.01 434.99 7789.65 25793.19
TPC-DS Q20 97.40 125.16 139.32 14255.65 432.73
TPC-DS Q21 7677.42 115.28 274.69 3808.50 136.01
TPC-DS Q22 2931.76 277.51 270.36 1040.16 452.07
TPC-DS Q23a+b 885.41 847.03 621.95 41871.17 1384.82
TPC-DS Q24a+b 3350.83 3174.31 3831.31 4005.44 4162.98
TPC-DS Q25 817.57 826.34 851.26 1044.04 801.04
TPC-DS Q26 150.48 139.26 158.75 357.60 464.47
TPC-DS Q27 6555.77 810.79 782.19 977.48 1066.21
TPC-DS Q28 1734.06 1044.71 686.95 1240.80 1339.89
TPC-DS Q29 747.44 756.86 1132.73 1366.01 1192.19
TPC-DS Q30 191.30 25.81 33.17 82.61 11.07
TPC-DS Q31 2563.32 1246.91 5385.29 1812.21 1066.69
TPC-DS Q32 153.86 154.81 137.56 167.41 158.73
TPC-DS Q33 98.75 81.36 68.85 115.08 78.96
TPC-DS Q34 1818.60 328.39 236.52 472.46 133.31
TPC-DS Q35 32.59 29.95 30.48 38.18 24.89
TPC-DS Q36 841.94 565.84 574.60 766.96 565.11
TPC-DS Q37 482.81 342.44 592.50 492.02 534.97
TPC-DS Q38 6.32 6.28 5.41 4.89 6.82
TPC-DS Q39a+b 10.05 8.25 7.14 11.79 11.59
TPC-DS Q40 2360.66 541.37 785.37 533.41 761.12
TPC-DS Q41 5.80 5.89 37.51 6.48 11.55
TPC-DS Q42 65.77 64.91 70.27 74.08 153.14
TPC-DS Q43 280.81 225.06 267.67 296.65 401.79
TPC-DS Q44 32553.06 5740.13 478.14 5390.60 4231.37
TPC-DS Q45 145.31 142.65 146.96 145.81 176.72
TPC-DS Q46 864.18 204.38 210.67 219.54 175.63
TPC-DS Q47 184.57 137.03 165.87 147.89 197.19
TPC-DS Q48 183.77 161.29 174.82 207.64 276.78
TPC-DS Q49 8313.61 1093.56 903.92 1055.62 1131.00
TPC-DS Q50 864.38 717.24 733.83 604.91 813.81
TPC-DS Q51 91.12 95.57 109.52 137.41 234.60
TPC-DS Q52 64.85 63.04 196.57 572.37 100.53
TPC-DS Q53 273.91 90.94 306.55 86.12 98.07
TPC-DS Q54 98.67 98.26 302.96 124.66 125.56
TPC-DS Q55 70.61 48.51 184.94 87.97 72.03
TPC-DS Q56 2037.01 2227.03 2069.12 2244.94 2396.48
TPC-DS Q57 226.64 144.32 145.91 164.27 374.95
TPC-DS Q58 1799.45 439.38 440.71 614.94 747.81
TPC-DS Q59 991.79 768.36 964.88 895.87 728.67
TPC-DS Q60 3212.06 3104.75 4233.68 3529.38 3355.82
TPC-DS Q61 472.16 178.71 182.90 423.99 251.76
TPC-DS Q62 361.57 248.52 1303.95 242.52 253.02
TPC-DS Q63 125.88 103.57 2509.54 146.43 91.01
TPC-DS Q64 10774.75 2188.13 2379.56 3400.74 3473.68
TPC-DS Q65 201.24 202.42 188.75 201.48 163.07
TPC-DS Q66 1821.07 1386.27 1579.40 2479.53 4026.82
TPC-DS Q67 19.43 17.27 16.10 1680.60 76.35
TPC-DS Q68 286.35 252.43 242.65 179.01 221.11
TPC-DS Q69 39.58 34.79 32.38 49.93 30.61
TPC-DS Q70 540.12 12.50 6.93 14.34 8.28
TPC-DS Q71 168.06 135.65 94.49 107.96 132.17
TPC-DS Q72 1688.20 631.94 532.54 897.29 680.48
TPC-DS Q73 108.79 97.90 105.01 158.49 236.45
TPC-DS Q74 689.27 476.11 381.40 940.41 803.10
TPC-DS Q75 6573.59 3550.55 5712.90 3882.19 4518.24
TPC-DS Q76 20834.45 5040.30 269.67 5219.21 5008.92
TPC-DS Q77 740.88 710.68 545.66 788.12 656.38
TPC-DS Q78 7206.13 2682.08 5491.52 5602.49 5649.14
TPC-DS Q79 139.08 148.61 154.51 160.40 237.46
TPC-DS Q80 6120.70 5939.55 7249.11 8925.97 9619.09
TPC-DS Q81 182.25 28.04 17.52 21.52 17.28
TPC-DS Q82 453.41 429.05 730.50 361.56 378.46
TPC-DS Q83 27.07 20.55 49.51 23.09 18.27
TPC-DS Q84 53.71 33.24 27.15 77.00 26.38
TPC-DS Q85 420.64 371.79 373.49 597.47 738.88
TPC-DS Q86 185.09 202.03 178.51 441.08 253.73
TPC-DS Q87 6.67 6.64 4.94 11.68 8.14
TPC-DS Q88 756.03 654.05 734.00 979.32 1116.13
TPC-DS Q89 189.44 149.20 151.75 179.42 223.14
TPC-DS Q91 171.14 31.49 478.53 86.20 79.90
TPC-DS Q92 125.06 137.27 121.95 134.68 212.19
TPC-DS Q93 1869.49 1905.25 4202.07 3808.53 3754.87
TPC-DS Q94 35218.64 33696.25 129556.76 35459.53 163957.84
TPC-DS Q95 38308.70 37077.34 61195.83 49604.13 56100.01
TPC-DS Q96 41.19 34.42 27.86 13180.38 58.11
TPC-DS Q97 69.07 47.53 51.63 21225.57 69.97
TPC-DS Q98 134.70 99.39 120.01 28621.51 96.24
TPC-DS Q99 277.76 295.99 266.47 15876.60 255.60
### Loading [s]
timeGenerate timeIngesting timeSchema timeIndex timeLoad
MonetDB-BHT-8-1-1 1.0 257.0 11.0 1070.0 1376.0
MonetDB-BHT-8-2-1 1.0 257.0 11.0 1070.0 1376.0
MonetDB-BHT-8-3-1 1.0 257.0 11.0 1070.0 1376.0
MonetDB-BHT-8-3-2 1.0 257.0 11.0 1070.0 1376.0
MonetDB-BHT-8-3-3 1.0 257.0 11.0 1070.0 1376.0
### Geometric Mean of Medians of Timer Run [s]
Geo Times [s]
DBMS
MonetDB-BHT-8-1-1 0.64
MonetDB-BHT-8-2-1 0.26
MonetDB-BHT-8-3-1 0.33
MonetDB-BHT-8-3-2 0.53
MonetDB-BHT-8-3-3 0.37
### Power@Size ((3600*SF)/(geo times))
Power@Size [~Q/h]
DBMS
MonetDB-BHT-8-1-1 168770.19
MonetDB-BHT-8-2-1 411294.30
MonetDB-BHT-8-3-1 332405.14
MonetDB-BHT-8-3-2 204235.70
MonetDB-BHT-8-3-3 290573.47
### Throughput@Size ((runs*queries*streams*3600*SF)/(span of time))
time [s] count SF Throughput@Size
DBMS SF num_experiment num_client
MonetDB-BHT-8-1 30.0 1 1 605 1 30.0 17494.21
MonetDB-BHT-8-2 30.0 1 2 189 1 30.0 56000.00
MonetDB-BHT-8-3 30.0 1 3 436 3 30.0 72825.69
### Workflow
orig_name SF pods num_experiment num_client benchmark_start benchmark_end
MonetDB-BHT-8-1-1 MonetDB-BHT-8-1 30.0 8 1 1 1772481970 1772482575
MonetDB-BHT-8-2-1 MonetDB-BHT-8-2 30.0 8 1 2 1772482728 1772482917
MonetDB-BHT-8-3-1 MonetDB-BHT-8-3 30.0 8 1 3 1772483055 1772483456
MonetDB-BHT-8-3-2 MonetDB-BHT-8-3 30.0 8 1 3 1772483055 1772483429
MonetDB-BHT-8-3-3 MonetDB-BHT-8-3 30.0 8 1 3 1772483055 1772483491
#### Actual
DBMS MonetDB-BHT-8 - Pods [[1, 1, 3]]
#### Planned
DBMS MonetDB-BHT-8 - Pods [[1, 1, 3]]
### Execution - SUT
CPU [CPUs] Max CPU Max RAM [Gb] Max RAM Cached [Gb]
MonetDB-BHT-8-1 9057.51 72.35 177.71 177.80
MonetDB-BHT-8-2 2853.24 22.14 47.24 47.32
MonetDB-BHT-8-3 15960.43 72.12 263.95 264.03
### Execution - Benchmarker
CPU [CPUs] Max CPU Max RAM [Gb] Max RAM Cached [Gb]
MonetDB-BHT-8-1 11.90 0.16 0.30 0.3
MonetDB-BHT-8-2 11.90 0.01 0.30 0.3
MonetDB-BHT-8-3 31.49 0.57 0.29 0.3
### Tests
TEST passed: Geo Times [s] contains no 0 or NaN
TEST passed: Power@Size [~Q/h] contains no 0 or NaN
TEST passed: Throughput@Size contains no 0 or NaN
TEST failed: SQL errors
TEST failed: SQL warnings (result mismatch)
TEST passed: Workflow as planned
TEST passed: Execution SUT contains no 0 or NaN in CPU [CPUs]
TEST passed: Execution Benchmarker contains no 0 or NaN in CPU [CPUs]