Example: Prepare Testbeds
Overview
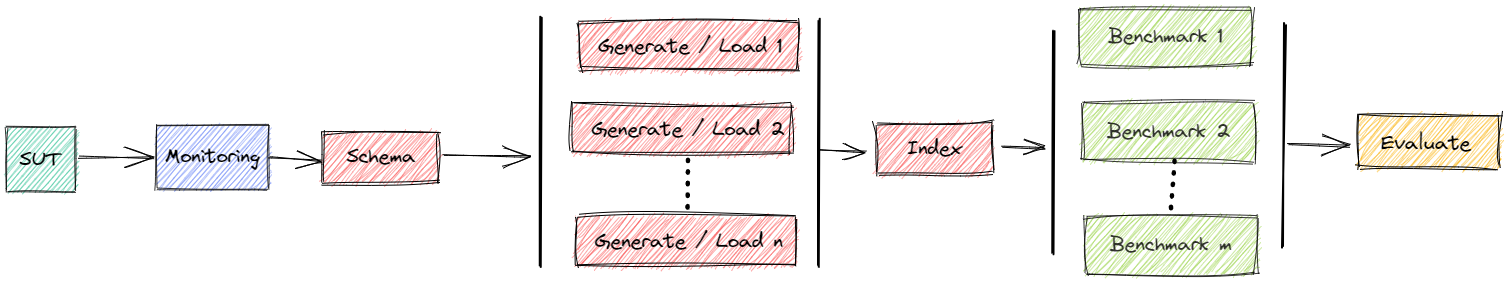
A testbed is a running, data-loaded DBMS deployment inside the Kubernetes cluster, ready for benchmarking. Preparing a testbed involves the following steps:
Start the SUT (System Under Test — the DBMS container).
Start monitoring.
Run the loading phase (generate and import data).
Run the benchmarking phase.
Collect and evaluate measurements.
Remove all ephemeral components from the cluster.
Normally you want all phases to run in one go. Bexhoma exposes three operating modes that let you stop the process at different points, which is useful for debugging, extending the implementation, or inspecting the DBMS state after loading.
Note: All examples below keep the DBMS running after the experiment finishes. The summary output includes a “Services” section with the
kubectl port-forwardcommand to connect to the running instance.
Operating Modes
Every benchmark script (ycsb.py, benchbase.py, hammerdb.py, tpch.py, tpcds.py) accepts the same three positional mode arguments:
Mode |
What happens |
|---|---|
|
Start the SUT only. No data is loaded. Useful to inspect the fresh DBMS or run custom SQL by hand. |
|
Start the SUT and run the data loading phase. Stops before benchmarking. Useful to pre-populate a volume and check import metrics. |
|
Full experiment: start SUT, load data (or reuse an existing volume), run the benchmark, collect results. |
Data volumes are identified by DBMS, benchmark, and scale factor.
If a volume already exists and is marked as loaded, the load step is skipped automatically in run mode — the data is reused.
Environment Variables
The examples below assume three node-selector variables and a log directory.
Adjust the node names to match your cluster, or drop -rnn/-rnl/-rnb entirely to let Kubernetes schedule freely.
BEXHOMA_NODE_SUT="cl-worker11"
BEXHOMA_NODE_LOAD="cl-worker19"
BEXHOMA_NODE_BENCHMARK="cl-worker19"
LOG_DIR="./logs_tests"
BEXHOMA_MS=1        # number of parallel experiment management processes

mkdir -p $LOG_DIR
Reading the Summary Output
After each mode completes, Bexhoma prints a summary. The sections have consistent meaning across all benchmark types:
Section |
Present in |
Description |
|---|---|---|
Workload |
all modes |
Experiment metadata: type, code, duration, parameter choices, bexhoma version |
Services |
all modes |
|
Connections |
all modes |
Hardware details of the node hosting the SUT (RAM, CPU, disk, resource requests) |
Loading |
|
Import throughput metrics (rows/second, time, pod count) |
Execution |
|
Benchmark results: throughput, latency, error count |
Workflow |
|
Planned vs. actual pod configuration — useful for verifying scale-out |
Ingestion - SUT |
|
CPU and RAM consumed by the DBMS during the loading phase |
Ingestion - Loader |
|
CPU and RAM consumed by the loader pods during the loading phase |
Execution - SUT |
|
CPU and RAM consumed by the DBMS during benchmarking |
Execution - Benchmarker |
|
CPU and RAM consumed by the driver pods during benchmarking |
Tests |
all modes |
Automated sanity checks — e.g., no zero throughput, no NaN metrics, workflow matches plan |
A TEST failed line does not necessarily abort the experiment; it flags a condition worth investigating (e.g., a query error in TPC-DS Q90, or a monitoring gap). A TEST skipped line means the check was inconclusive rather than failing — e.g. a component with pre-existing data produces no CPU load, or a phase ran shorter than one Prometheus scrape interval so a CPU counter delta of 0 cannot be distinguished from a real gap.
Inspecting Cluster State
You can watch or clean up all pods belonging to a specific benchmark using its use-case label:
# Watch components
kubectl get all -l app=bexhoma,usecase=<label>

# Remove all components
kubectl delete all -l app=bexhoma,usecase=<label>
Benchmark |
Label |
|---|---|
YCSB |
|
Benchbase TPC-C |
|
HammerDB TPC-C |
|
TPC-H |
|
TPC-DS |
|
YCSB
YCSB is a key-value workload generator.
Configurations are numbered sequentially per DBMS — the first configuration is PostgreSQL-1, the second PostgreSQL-2, and so on.
Start DBMS
Starts PostgreSQL without loading any data. After this completes you can connect to the instance and run queries manually.
bexhoma ycsb \
  -dbms PostgreSQL \
  -xwl c \
  -m \
  -mc \
  -ms $BEXHOMA_MS \
  -tr \
  -lr 64Gi \
  -rr 64Gi \
  -rnn $BEXHOMA_NODE_SUT \
  start &>$LOG_DIR/docs_ycsb_postgresql_start.log
docs_ycsb_postgresql_start.log
## Show Summary

### Workload
YCSB Start DBMS
* Type: ycsb
* Duration: 193s
* Code: 1782745268
* Start DBMS and do not load data.
* This just starts a SUT.
  * Workload is 'C'.
  * Experiment uses bexhoma version 0.10.2.
  * System metrics are monitored by a cluster-wide installation.
  * Experiment is limited to DBMS ['PostgreSQL'].
  * SUT is fixed to cl-worker38.
  * Experiment is run once.

### Services
PostgreSQL-1
* kubectl --context oidc_ds_cluster port-forward service/bexhoma-sut-postgresql-1-1782745268 9091:9091

### Connections
* PostgreSQL-1-1 uses docker image postgres:18.3
  * RAM:540492877824
  * CPU:Intel(R) Xeon(R) Gold 6430
  * Cores:128
  * host:6.8.0-111-generic
  * node:cl-worker38
  * disk:268118
  * datadisk:39
  * cpu_list:0-127
  * args:['-c', 'max_connections=640', '-c', 'max_worker_processes=16', '-c', 'max_parallel_workers=16', '-c', 'max_parallel_workers_per_gather=8', '-c', 'max_parallel_maintenance_workers=4', '-c', 'shared_buffers=16GB', '-c', 'effective_cache_size=40GB', '-c', 'work_mem=512MB', '-c', 'maintenance_work_mem=2GB', '-c', 'autovacuum=off', '-c', 'wal_level=minimal', '-c', 'max_wal_senders=0', '-c', 'max_wal_size=32GB', '-c', 'checkpoint_timeout=1h', '-c', 'checkpoint_completion_target=1.0', '-c', 'lock_timeout=30s', '-c', 'idle_in_transaction_session_timeout=30000']
  * requests_cpu:4
  * requests_memory:16Gi
  * eval_parameters
    * code:1782745268

### Tests
The summary confirms the SUT is running and shows the port-forward command.
Start DBMS and Load Data
Starts PostgreSQL and imports YCSB data using 8 parallel loader pods with 64 threads each.
bexhoma ycsb \
  -dbms PostgreSQL \
  -xwl c \
  -nlp 8 \
  -nlt 64 \
  -m \
  -mc \
  -ms $BEXHOMA_MS \
  -tr \
  -lr 64Gi \
  -rr 64Gi \
  -rss 50Gi \
  -rnn $BEXHOMA_NODE_SUT -rnl $BEXHOMA_NODE_LOAD \
  load &>$LOG_DIR/docs_ycsb_postgresql_load.log
docs_ycsb_postgresql_load.log
## Show Summary

### Workload
YCSB Data Loading SF=1
* Type: ycsb
* Duration: 345s
* Code: 1782745500
* YCSB driver runs the experiment.
* This imports YCSB data sets.
  * Workload is 'C'.
  * Number of rows to insert is 1000000.
  * Ordering of inserts is hashed.
  * Target is based on multiples of '16384'.
  * Factors for loading are [1].
  * Experiment uses bexhoma version 0.10.2.
  * System metrics are monitored by a cluster-wide installation.
  * Experiment is limited to DBMS ['PostgreSQL'].
  * Import is handled by 8 processes (pods).
  * Loading is fixed to cl-worker19.
  * SUT is fixed to cl-worker38.
  * Loading is tested with [64] threads, split into [8] pods.
  * Experiment is run once.

### Services
PostgreSQL-1
* kubectl --context oidc_ds_cluster port-forward service/bexhoma-sut-postgresql-1-1782745500 9091:9091

### Connections
* PostgreSQL-1-1 uses docker image postgres:18.3
  * RAM:540492877824
  * CPU:Intel(R) Xeon(R) Gold 6430
  * Cores:128
  * host:6.8.0-111-generic
  * node:cl-worker38
  * disk:265876
  * datadisk:2391
  * cpu_list:0-127
  * args:['-c', 'max_connections=640', '-c', 'max_worker_processes=16', '-c', 'max_parallel_workers=16', '-c', 'max_parallel_workers_per_gather=8', '-c', 'max_parallel_maintenance_workers=4', '-c', 'shared_buffers=16GB', '-c', 'effective_cache_size=40GB', '-c', 'work_mem=512MB', '-c', 'maintenance_work_mem=2GB', '-c', 'autovacuum=off', '-c', 'wal_level=minimal', '-c', 'max_wal_senders=0', '-c', 'max_wal_size=32GB', '-c', 'checkpoint_timeout=1h', '-c', 'checkpoint_completion_target=1.0', '-c', 'lock_timeout=30s', '-c', 'idle_in_transaction_session_timeout=30000']
  * requests_cpu:4
  * requests_memory:16Gi
  * eval_parameters
    * code:1782745500

### Loading

#### Per Connection

| connection           |   experiment_run |   threads |   target |   pod_count |   exceptions |   [OVERALL].Throughput(ops/sec) |   [OVERALL].RunTime(ms) |   [INSERT].Return=OK |   [INSERT].99thPercentileLatency(us) |   sf |   Throughput [SF/h] |
|:---------------------|-----------------:|----------:|---------:|------------:|-------------:|--------------------------------:|------------------------:|---------------------:|-------------------------------------:|-----:|--------------------:|
| PostgreSQL-1-1-0-1-1 |             1.00 |      8.00 |  2048.00 |        8.00 |         0.00 |                         2038.82 |                61310.00 |            125000.00 |                              2675.00 | 1.00 |               58.72 |
| PostgreSQL-1-1-0-1-2 |             1.00 |      8.00 |  2048.00 |        8.00 |         0.00 |                         2039.75 |                61282.00 |            125000.00 |                              2913.00 | 1.00 |               58.74 |
| PostgreSQL-1-1-0-1-3 |             1.00 |      8.00 |  2048.00 |        8.00 |         0.00 |                         2039.52 |                61289.00 |            125000.00 |                              2387.00 | 1.00 |               58.74 |
| PostgreSQL-1-1-0-1-4 |             1.00 |      8.00 |  2048.00 |        8.00 |         0.00 |                         2038.49 |                61320.00 |            125000.00 |                              2701.00 | 1.00 |               58.71 |
| PostgreSQL-1-1-0-1-5 |             1.00 |      8.00 |  2048.00 |        8.00 |         0.00 |                         2039.55 |                61288.00 |            125000.00 |                              2349.00 | 1.00 |               58.74 |
| PostgreSQL-1-1-0-1-6 |             1.00 |      8.00 |  2048.00 |        8.00 |         0.00 |                         2039.22 |                61298.00 |            125000.00 |                              2709.00 | 1.00 |               58.73 |
| PostgreSQL-1-1-0-1-7 |             1.00 |      8.00 |  2048.00 |        8.00 |         0.00 |                         2038.69 |                61314.00 |            125000.00 |                              2747.00 | 1.00 |               58.71 |
| PostgreSQL-1-1-0-1-8 |             1.00 |      8.00 |  2048.00 |        8.00 |         0.00 |                         2040.15 |                61270.00 |            125000.00 |                              2389.00 | 1.00 |               58.76 |

#### Per Run

| DBMS           |   experiment_run |   threads |   target |   pod_count |   exceptions |   sf |   Throughput [SF/h] |   [OVERALL].Throughput(ops/sec) |   [OVERALL].RunTime(ms) |   [INSERT].Return=OK |   [INSERT].99thPercentileLatency(us) |
|:---------------|-----------------:|----------:|---------:|------------:|-------------:|-----:|--------------------:|--------------------------------:|------------------------:|---------------------:|-------------------------------------:|
| PostgreSQL-1-1 |             1.00 |     64.00 | 16384.00 |        8.00 |         0.00 | 1.00 |               58.71 |                        16314.18 |                61320.00 |           1000000.00 |                              2608.75 |

### Monitoring

### Loading phase: SUT deployment

| DBMS           |   CPU [CPUs] |   Max CPU |   Max RAM [Gb] |   Max RAM Cached [Gb] |
|:---------------|-------------:|----------:|---------------:|----------------------:|
| PostgreSQL-1-1 |       240.39 |      3.85 |           1.57 |                  2.66 |

### Loading phase: component loader

| DBMS           |   CPU [CPUs] |   Max CPU |   Max RAM [Gb] |   Max RAM Cached [Gb] |
|:---------------|-------------:|----------:|---------------:|----------------------:|
| PostgreSQL-1-1 |       109.61 |      2.74 |           0.11 |                  0.11 |

### Tests
* TEST passed: Loading phase: SUT deployment contains no 0 or NaN in CPU [CPUs]
* TEST passed: Loading phase: component loader contains no 0 or NaN in CPU [CPUs]
* TEST passed: Loading Phase: [OVERALL].Throughput(ops/sec) contains no 0 or NaN
Key parameters:
-nlp 8: 8 parallel loader pods-nlt 64: 64 threads per loader pod
The summary’s Loading table shows aggregate throughput across all loader pods. The Ingestion tables show how much CPU and RAM the SUT and loader consumed.
Start DBMS and Load Data and Run Workload
Full experiment: loads data and then runs YCSB workload C with 8 benchmarker pods.
bexhoma ycsb \
  -dbms PostgreSQL \
  -xwl c \
  -nlp 8 \
  -nlt 64 \
  -nbp 8 \
  -nbt 64 \
  -m \
  -mc \
  -ms $BEXHOMA_MS \
  -ss \
  -tr \
  -lr 64Gi \
  -rr 64Gi \
  -rss 50Gi \
  -rnn $BEXHOMA_NODE_SUT -rnl $BEXHOMA_NODE_LOAD -rnb $BEXHOMA_NODE_BENCHMARK \
  run &>$LOG_DIR/docs_ycsb_postgresql_run.log
docs_ycsb_postgresql_run.log
## Show Summary

### Workload
YCSB SF=1
* Type: ycsb
* Duration: 445s
* Code: 1782745902
* YCSB driver runs the experiment.
* This experiment compares run time and resource consumption of YCSB queries.
  * Workload is 'C'.
  * Number of rows to insert is 1000000.
  * Ordering of inserts is hashed.
  * Number of operations is 1000000.
  * Batch size is ''.
  * Target is based on multiples of '16384'.
  * Factors for loading are [1].
  * Factors for benchmarking are [1].
  * Experiment uses bexhoma version 0.10.2.
  * System metrics are monitored by a cluster-wide installation.
  * Experiment is limited to DBMS ['PostgreSQL'].
  * Import is handled by 8 processes (pods).
  * Loading is fixed to cl-worker19.
  * Benchmarking is fixed to cl-worker19.
  * SUT is fixed to cl-worker38.
  * Loading is tested with [64] threads, split into [8] pods.
  * Benchmarking is tested with [64] threads, split into [8] pods.
  * Benchmarking is run as [1] times the number of benchmarking pods.
  * Experiment is run once.

### Connections
* PostgreSQL-1-1-1-1 uses docker image postgres:18.3
  * RAM:540492877824
  * CPU:Intel(R) Xeon(R) Gold 6430
  * Cores:128
  * host:6.8.0-111-generic
  * node:cl-worker38
  * disk:265876
  * datadisk:2391
  * cpu_list:0-127
  * args:['-c', 'max_connections=640', '-c', 'max_worker_processes=16', '-c', 'max_parallel_workers=16', '-c', 'max_parallel_workers_per_gather=8', '-c', 'max_parallel_maintenance_workers=4', '-c', 'shared_buffers=16GB', '-c', 'effective_cache_size=40GB', '-c', 'work_mem=512MB', '-c', 'maintenance_work_mem=2GB', '-c', 'autovacuum=off', '-c', 'wal_level=minimal', '-c', 'max_wal_senders=0', '-c', 'max_wal_size=32GB', '-c', 'checkpoint_timeout=1h', '-c', 'checkpoint_completion_target=1.0', '-c', 'lock_timeout=30s', '-c', 'idle_in_transaction_session_timeout=30000']
  * requests_cpu:4
  * requests_memory:16Gi
  * eval_parameters
    * code:1782745902

### Workflow

#### Actual

* DBMS PostgreSQL-1 - Experiment 1 Client 1: ycsb (8 pods)

#### Planned

* DBMS PostgreSQL-1 - Experiment 1 Client 1: ycsb (8 pods)

### Loading

#### Per Connection

| connection           |   experiment_run |   threads |   target |   pod_count |   exceptions |   [OVERALL].Throughput(ops/sec) |   [OVERALL].RunTime(ms) |   [INSERT].Return=OK |   [INSERT].99thPercentileLatency(us) |   sf |   Throughput [SF/h] |
|:---------------------|-----------------:|----------:|---------:|------------:|-------------:|--------------------------------:|------------------------:|---------------------:|-------------------------------------:|-----:|--------------------:|
| PostgreSQL-1-1-0-1-1 |             1.00 |      8.00 |  2048.00 |        8.00 |         0.00 |                         2039.95 |                61276.00 |            125000.00 |                              2019.00 | 1.00 |               58.75 |
| PostgreSQL-1-1-0-1-2 |             1.00 |      8.00 |  2048.00 |        8.00 |         0.00 |                         2040.55 |                61258.00 |            125000.00 |                              1974.00 | 1.00 |               58.77 |
| PostgreSQL-1-1-0-1-3 |             1.00 |      8.00 |  2048.00 |        8.00 |         0.00 |                         2040.38 |                61263.00 |            125000.00 |                              1828.00 | 1.00 |               58.76 |
| PostgreSQL-1-1-0-1-4 |             1.00 |      8.00 |  2048.00 |        8.00 |         0.00 |                         2039.88 |                61278.00 |            125000.00 |                              2009.00 | 1.00 |               58.75 |
| PostgreSQL-1-1-0-1-5 |             1.00 |      8.00 |  2048.00 |        8.00 |         0.00 |                         2040.18 |                61269.00 |            125000.00 |                              2000.00 | 1.00 |               58.76 |
| PostgreSQL-1-1-0-1-6 |             1.00 |      8.00 |  2048.00 |        8.00 |         0.00 |                         2040.25 |                61267.00 |            125000.00 |                              2005.00 | 1.00 |               58.76 |
| PostgreSQL-1-1-0-1-7 |             1.00 |      8.00 |  2048.00 |        8.00 |         0.00 |                         2040.38 |                61263.00 |            125000.00 |                              1903.00 | 1.00 |               58.76 |
| PostgreSQL-1-1-0-1-8 |             1.00 |      8.00 |  2048.00 |        8.00 |         0.00 |                         2040.15 |                61270.00 |            125000.00 |                              1953.00 | 1.00 |               58.76 |

#### Per Run

| DBMS           |   experiment_run |   threads |   target |   pod_count |   exceptions |   sf |   Throughput [SF/h] |   [OVERALL].Throughput(ops/sec) |   [OVERALL].RunTime(ms) |   [INSERT].Return=OK |   [INSERT].99thPercentileLatency(us) |
|:---------------|-----------------:|----------:|---------:|------------:|-------------:|-----:|--------------------:|--------------------------------:|------------------------:|---------------------:|-------------------------------------:|
| PostgreSQL-1-1 |             1.00 |     64.00 | 16384.00 |        8.00 |         0.00 | 1.00 |               58.75 |                        16321.73 |                61278.00 |           1000000.00 |                              1961.38 |

### Execution

#### Per Connection

| DBMS                 | phase            | job                | configuration   |   experiment_run |   client |   benchmark_run |   child |   threads |   target |   pod_count |   exceptions |   [OVERALL].Throughput(ops/sec) |   [OVERALL].RunTime(ms) |   [READ].Return=OK |   [READ].99thPercentileLatency(us) |
|:---------------------|:-----------------|:-------------------|:----------------|-----------------:|---------:|----------------:|--------:|----------:|---------:|------------:|-------------:|--------------------------------:|------------------------:|-------------------:|-----------------------------------:|
| PostgreSQL-1-1-1-1-2 | PostgreSQL-1-1-1 | PostgreSQL-1-1-1-1 | PostgreSQL-1    |                1 |        1 |               1 |       2 |         8 |     2048 |           8 |            0 |                         2040.52 |                61259.00 |             125000 |                             897.00 |
| PostgreSQL-1-1-1-1-1 | PostgreSQL-1-1-1 | PostgreSQL-1-1-1-1 | PostgreSQL-1    |                1 |        1 |               1 |       1 |         8 |     2048 |           8 |            0 |                         2040.02 |                61274.00 |             125000 |                            1001.00 |
| PostgreSQL-1-1-1-1-7 | PostgreSQL-1-1-1 | PostgreSQL-1-1-1-1 | PostgreSQL-1    |                1 |        1 |               1 |       7 |         8 |     2048 |           8 |            0 |                         2039.98 |                61275.00 |             125000 |                             959.00 |
| PostgreSQL-1-1-1-1-6 | PostgreSQL-1-1-1 | PostgreSQL-1-1-1-1 | PostgreSQL-1    |                1 |        1 |               1 |       6 |         8 |     2048 |           8 |            0 |                         2039.98 |                61275.00 |             125000 |                             868.00 |
| PostgreSQL-1-1-1-1-8 | PostgreSQL-1-1-1 | PostgreSQL-1-1-1-1 | PostgreSQL-1    |                1 |        1 |               1 |       8 |         8 |     2048 |           8 |            0 |                         2039.35 |                61294.00 |             125000 |                             943.00 |
| PostgreSQL-1-1-1-1-3 | PostgreSQL-1-1-1 | PostgreSQL-1-1-1-1 | PostgreSQL-1    |                1 |        1 |               1 |       3 |         8 |     2048 |           8 |            0 |                         2040.08 |                61272.00 |             125000 |                             836.00 |
| PostgreSQL-1-1-1-1-4 | PostgreSQL-1-1-1 | PostgreSQL-1-1-1-1 | PostgreSQL-1    |                1 |        1 |               1 |       4 |         8 |     2048 |           8 |            0 |                         2040.18 |                61269.00 |             125000 |                             822.00 |
| PostgreSQL-1-1-1-1-5 | PostgreSQL-1-1-1 | PostgreSQL-1-1-1-1 | PostgreSQL-1    |                1 |        1 |               1 |       5 |         8 |     2048 |           8 |            0 |                         2040.05 |                61273.00 |             125000 |                             832.00 |

#### Per Phase

| DBMS             | phase            |   experiment_run |   threads |   target |   benchmark_run |   pod_count |   exceptions |   [OVERALL].Throughput(ops/sec) |   [OVERALL].RunTime(ms) |   [READ].Return=OK |   [READ].99thPercentileLatency(us) |
|:-----------------|:-----------------|-----------------:|----------:|---------:|----------------:|------------:|-------------:|--------------------------------:|------------------------:|-------------------:|-----------------------------------:|
| PostgreSQL-1-1-1 | PostgreSQL-1-1-1 |                1 |        64 |    16384 |               1 |           8 |            0 |                        16320.17 |                61294.00 |            1000000 |                            1001.00 |

### Monitoring

### Loading phase: SUT deployment

| DBMS               |   CPU [CPUs] |   Max CPU |   Max RAM [Gb] |   Max RAM Cached [Gb] |
|:-------------------|-------------:|----------:|---------------:|----------------------:|
| PostgreSQL-1-1-1-1 |       245.70 |      3.96 |           1.56 |                  2.58 |

### Loading phase: component loader

| DBMS               |   CPU [CPUs] |   Max CPU |   Max RAM [Gb] |   Max RAM Cached [Gb] |
|:-------------------|-------------:|----------:|---------------:|----------------------:|
| PostgreSQL-1-1-1-1 |        63.22 |      2.19 |           0.11 |                  0.11 |

### Execution phase: SUT deployment

| DBMS               |   CPU [CPUs] |   Max CPU |   Max RAM [Gb] |   Max RAM Cached [Gb] |
|:-------------------|-------------:|----------:|---------------:|----------------------:|
| PostgreSQL-1-1-1-1 |        72.04 |      2.71 |           1.85 |                  3.02 |

### Execution phase: component benchmarker

| DBMS               |   CPU [CPUs] |   Max CPU |   Max RAM [Gb] |   Max RAM Cached [Gb] |
|:-------------------|-------------:|----------:|---------------:|----------------------:|
| PostgreSQL-1-1-1-1 |        64.29 |      1.59 |           0.10 |                  0.11 |

### Tests
* TEST passed: Loading phase: SUT deployment contains no 0 or NaN in CPU [CPUs]
* TEST passed: Loading phase: component loader contains no 0 or NaN in CPU [CPUs]
* TEST passed: Execution phase: SUT deployment contains no 0 or NaN in CPU [CPUs]
* TEST passed: Execution phase: component benchmarker contains no 0 or NaN in CPU [CPUs]
* TEST passed: Loading Phase: [OVERALL].Throughput(ops/sec) contains no 0 or NaN
* TEST passed: Execution Phase: [OVERALL].Throughput(ops/sec) contains no 0 or NaN
* TEST passed: Workflow as planned
* TEST passed: Execution Phase: contains no FAILED column
Key parameters:
-nbp 8: 8 parallel benchmarker pods-nbt 64: 64 threads per benchmarker pod-ss: use a single shared storage volume
The Execution table aggregates throughput across all benchmarker pods. The Workflow section confirms the actual pod count matched the plan.
Benchbase (TPC-C)
Benchbase runs TPC-C transactions.
Configurations are numbered sequentially per DBMS — PostgreSQL-1, PostgreSQL-2, etc.
Start DBMS
bexhoma benchbase \
  -dbms PostgreSQL \
  -m \
  -mc \
  -ms $BEXHOMA_MS \
  -tr \
  -lr 64Gi \
  -rr 64Gi \
  -rnn $BEXHOMA_NODE_SUT \
  start &>$LOG_DIR/docs_benchbase_postgresql_start.log
docs_benchbase_postgresql_start.log
## Show Summary

### Workload
Benchbase Start DBMS
* Type: benchbase
* Duration: 194s
* Code: 1782746392
* Start DBMS and do not load data.
* This just starts a SUT.
  * Experiment uses bexhoma version 0.10.2.
  * System metrics are monitored by a cluster-wide installation.
  * Experiment is limited to DBMS ['PostgreSQL'].
  * SUT is fixed to cl-worker38.
  * Experiment is run once.

### Services
PostgreSQL-1
* kubectl --context oidc_ds_cluster port-forward service/bexhoma-sut-postgresql-1-1782746392 9091:9091

### Connections
* PostgreSQL-1-1 uses docker image postgres:18.3
  * RAM:540492877824
  * CPU:Intel(R) Xeon(R) Gold 6430
  * Cores:128
  * host:6.8.0-111-generic
  * node:cl-worker38
  * disk:263525
  * datadisk:39
  * cpu_list:0-127
  * args:['-c', 'max_connections=640', '-c', 'max_worker_processes=16', '-c', 'max_parallel_workers=16', '-c', 'max_parallel_workers_per_gather=8', '-c', 'max_parallel_maintenance_workers=4', '-c', 'shared_buffers=16GB', '-c', 'effective_cache_size=40GB', '-c', 'work_mem=512MB', '-c', 'maintenance_work_mem=2GB', '-c', 'autovacuum=off', '-c', 'wal_level=minimal', '-c', 'max_wal_senders=0', '-c', 'max_wal_size=32GB', '-c', 'checkpoint_timeout=1h', '-c', 'checkpoint_completion_target=1.0', '-c', 'lock_timeout=30s', '-c', 'idle_in_transaction_session_timeout=30000']
  * requests_cpu:4
  * requests_memory:16Gi
  * eval_parameters
    * code:1782746392
    * TENANT_VOL:False

### Tests
* TEST skipped: Throughput (requests/second) (benchmarking phase not active)
Start DBMS and Load Data
Imports TPC-C data (scale factor 1) using 8 parallel loader pods.
bexhoma benchbase \
  -dbms PostgreSQL \
  -nlp 8 \
  -nlt 64 \
  -m \
  -mc \
  -ms $BEXHOMA_MS \
  -tr \
  -lr 64Gi \
  -rr 64Gi \
  -rss 50Gi \
  -rnn $BEXHOMA_NODE_SUT -rnl $BEXHOMA_NODE_LOAD \
  load &>$LOG_DIR/docs_benchbase_postgresql_load.log
docs_benchbase_postgresql_load.log
## Show Summary

### Workload
Benchbase Data tpcc Loading SF=1
* Type: benchbase
* Duration: 304s
* Code: 1782746612
* Benchbase runs a TPC-C experiment.
* This imports a Benchbase data set.
  * Benchbase data is generated and loaded using several threads. Scaling factor is 1. Target is based on multiples of '1024'.
  * Experiment uses bexhoma version 0.10.2.
  * System metrics are monitored by a cluster-wide installation.
  * Experiment is limited to DBMS ['PostgreSQL'].
  * Import is handled by 8 processes (pods).
  * Loading is fixed to cl-worker19.
  * SUT is fixed to cl-worker38.
  * Loading is tested with [64] threads, split into [8] pods.
  * Experiment is run once.

### Services
PostgreSQL-1
* kubectl --context oidc_ds_cluster port-forward service/bexhoma-sut-postgresql-1-1782746612 9091:9091

### Connections
* PostgreSQL-1-1 uses docker image postgres:18.3
  * RAM:540492877824
  * CPU:Intel(R) Xeon(R) Gold 6430
  * Cores:128
  * host:6.8.0-111-generic
  * node:cl-worker38
  * disk:263816
  * datadisk:330
  * cpu_list:0-127
  * args:['-c', 'max_connections=640', '-c', 'max_worker_processes=16', '-c', 'max_parallel_workers=16', '-c', 'max_parallel_workers_per_gather=8', '-c', 'max_parallel_maintenance_workers=4', '-c', 'shared_buffers=16GB', '-c', 'effective_cache_size=40GB', '-c', 'work_mem=512MB', '-c', 'maintenance_work_mem=2GB', '-c', 'autovacuum=off', '-c', 'wal_level=minimal', '-c', 'max_wal_senders=0', '-c', 'max_wal_size=32GB', '-c', 'checkpoint_timeout=1h', '-c', 'checkpoint_completion_target=1.0', '-c', 'lock_timeout=30s', '-c', 'idle_in_transaction_session_timeout=30000']
  * requests_cpu:4
  * requests_memory:16Gi
  * eval_parameters
    * code:1782746612
    * TENANT_VOL:False

### Loading

#### Per Run

|                |   experiment_run |   SF |   time_load |   time_preload |   time_generate |   time_ingest |   time_postload |   loading_pods |   terminals | tenant_id   | type_tenants   |   num_tenants | vol_tenants   |   Throughput [SF/h] |
|:---------------|-----------------:|-----:|------------:|---------------:|----------------:|--------------:|----------------:|---------------:|------------:|:------------|:---------------|--------------:|:--------------|--------------------:|
| PostgreSQL-1-1 |                1 |    1 |      103.00 |           0.00 |            0.00 |         36.00 |           67.00 |              1 |           1 |             |                |             0 | False         |               34.95 |

### Monitoring

### Loading phase: SUT deployment

| DBMS           |   CPU [CPUs] |   Max CPU |   Max RAM [Gb] |   Max RAM Cached [Gb] |
|:---------------|-------------:|----------:|---------------:|----------------------:|
| PostgreSQL-1-1 |        31.35 |      0.68 |           0.50 |                  0.65 |

### Loading phase: component loader

| DBMS           |   CPU [CPUs] |   Max CPU |   Max RAM [Gb] |   Max RAM Cached [Gb] |
|:---------------|-------------:|----------:|---------------:|----------------------:|
| PostgreSQL-1-1 |         7.69 |      0.00 |           0.24 |                  0.24 |

### Tests
* TEST passed: Loading phase: SUT deployment contains no 0 or NaN in CPU [CPUs]
* TEST passed: Loading phase: component loader contains no 0 or NaN in CPU [CPUs]
* TEST skipped: Throughput (requests/second) (benchmarking phase not active)
The Loading table reports Throughput [SF/h] — scale factors loaded per hour.
Start DBMS and Load Data and Run Workload
Loads data with 1 pod (Benchbase loads serially by design) and runs the workload with 8 benchmarker pods for 5 minutes.
bexhoma benchbase \
  -dbms PostgreSQL \
  -nlp 1 \
  -nlt 64 \
  -nbp 8 \
  -nbt 64 \
  -m \
  -mc \
  -ms $BEXHOMA_MS \
  -ss \
  -tr \
  -lr 64Gi \
  -rr 64Gi \
  -rss 50Gi \
  -rnn $BEXHOMA_NODE_SUT -rnl $BEXHOMA_NODE_LOAD -rnb $BEXHOMA_NODE_BENCHMARK \
  run &>$LOG_DIR/docs_benchbase_postgresql_run.log
docs_benchbase_postgresql_run.log
## Show Summary

### Workload
Benchbase Workload tpcc SF=1
* Type: benchbase
* Duration: 647s
* Code: 1782746959
* Benchbase runs a TPC-C experiment.
* This experiment compares run time and resource consumption of Benchbase queries in different DBMS.
  * Benchbase data is generated and loaded using several threads.
  * Benchmark is 'tpcc'. Scaling factor is 1. Target is based on multiples of '1024'. Factors for benchmarking are [1]. Benchmarking runs for 5 minutes.
  * Experiment uses bexhoma version 0.10.2.
  * System metrics are monitored by a cluster-wide installation.
  * Experiment is limited to DBMS ['PostgreSQL'].
  * Import is handled by 1 processes (pods).
  * Loading is fixed to cl-worker19.
  * Benchmarking is fixed to cl-worker19.
  * SUT is fixed to cl-worker38.
  * Loading is tested with [64] threads, split into [1] pods.
  * Benchmarking is tested with [64] threads, split into [8] pods.
  * Benchmarking is run as [1] times the number of benchmarking pods.
  * Experiment is run once.

### Connections
* PostgreSQL-1-1-1-1 uses docker image postgres:18.3
  * RAM:540492877824
  * CPU:Intel(R) Xeon(R) Gold 6430
  * Cores:128
  * host:6.8.0-111-generic
  * node:cl-worker38
  * disk:263816
  * datadisk:330
  * cpu_list:0-127
  * args:['-c', 'max_connections=640', '-c', 'max_worker_processes=16', '-c', 'max_parallel_workers=16', '-c', 'max_parallel_workers_per_gather=8', '-c', 'max_parallel_maintenance_workers=4', '-c', 'shared_buffers=16GB', '-c', 'effective_cache_size=40GB', '-c', 'work_mem=512MB', '-c', 'maintenance_work_mem=2GB', '-c', 'autovacuum=off', '-c', 'wal_level=minimal', '-c', 'max_wal_senders=0', '-c', 'max_wal_size=32GB', '-c', 'checkpoint_timeout=1h', '-c', 'checkpoint_completion_target=1.0', '-c', 'lock_timeout=30s', '-c', 'idle_in_transaction_session_timeout=30000']
  * requests_cpu:4
  * requests_memory:16Gi
  * eval_parameters
    * code:1782746959
    * TENANT_VOL:False

### Workflow

#### Actual

* DBMS PostgreSQL-1 - Experiment 1 Client 1: benchbase (8 pods)

#### Planned

* DBMS PostgreSQL-1 - Experiment 1 Client 1: benchbase (8 pods)

### Loading

#### Per Run

|                |   experiment_run |   SF |   time_load |   time_preload |   time_generate |   time_ingest |   time_postload |   loading_pods |   terminals | tenant_id   | type_tenants   |   num_tenants | vol_tenants   |   Throughput [SF/h] |
|:---------------|-----------------:|-----:|------------:|---------------:|----------------:|--------------:|----------------:|---------------:|------------:|:------------|:---------------|--------------:|:--------------|--------------------:|
| PostgreSQL-1-1 |                1 |    1 |      107.00 |           1.00 |            0.00 |         37.00 |           69.00 |              1 |           1 |             |                |             0 | False         |               33.64 |

### Execution

#### Per Connection

| DBMS                 | phase            | job                |   experiment_run |   terminals |   target |   client |   benchmark_run |   child |   tenant_id |   time |   num_errors |   Throughput (requests/second) |   Goodput (requests/second) |   efficiency |   Latency Distribution.95th Percentile Latency (microseconds) |   Latency Distribution.Average Latency (microseconds) |
|:---------------------|:-----------------|:-------------------|-----------------:|------------:|---------:|---------:|----------------:|--------:|------------:|-------:|-------------:|-------------------------------:|----------------------------:|-------------:|--------------------------------------------------------------:|------------------------------------------------------:|
| PostgreSQL-1-1-1-1-1 | PostgreSQL-1-1-1 | PostgreSQL-1-1-1-1 |                1 |           8 |      128 |        1 |               1 |       1 |           0 | 300.00 |            0 |                          56.49 |                       55.98 |         0.00 |                                                     727219.00 |                                             141543.00 |
| PostgreSQL-1-1-1-1-2 | PostgreSQL-1-1-1 | PostgreSQL-1-1-1-1 |                1 |           8 |      128 |        1 |               1 |       2 |           0 | 300.00 |            1 |                          56.43 |                       55.88 |         0.00 |                                                     704932.00 |                                             141432.00 |
| PostgreSQL-1-1-1-1-3 | PostgreSQL-1-1-1 | PostgreSQL-1-1-1-1 |                1 |           8 |      128 |        1 |               1 |       3 |           0 | 300.00 |            1 |                          53.84 |                       53.35 |         0.00 |                                                     741875.00 |                                             148149.00 |
| PostgreSQL-1-1-1-1-4 | PostgreSQL-1-1-1 | PostgreSQL-1-1-1-1 |                1 |           8 |      128 |        1 |               1 |       4 |           0 | 300.00 |            0 |                          56.23 |                       55.72 |         0.00 |                                                     709688.00 |                                             142130.00 |
| PostgreSQL-1-1-1-1-5 | PostgreSQL-1-1-1 | PostgreSQL-1-1-1-1 |                1 |           8 |      128 |        1 |               1 |       5 |           0 | 300.00 |            0 |                          55.08 |                       54.60 |         0.00 |                                                     717406.00 |                                             145030.00 |
| PostgreSQL-1-1-1-1-6 | PostgreSQL-1-1-1 | PostgreSQL-1-1-1-1 |                1 |           8 |      128 |        1 |               1 |       6 |           0 | 300.00 |            0 |                          55.42 |                       54.92 |         0.00 |                                                     725061.00 |                                             144290.00 |
| PostgreSQL-1-1-1-1-7 | PostgreSQL-1-1-1 | PostgreSQL-1-1-1-1 |                1 |           8 |      128 |        1 |               1 |       7 |           0 | 300.00 |            0 |                          53.93 |                       53.50 |         0.00 |                                                     735558.00 |                                             148209.00 |
| PostgreSQL-1-1-1-1-8 | PostgreSQL-1-1-1 | PostgreSQL-1-1-1-1 |                1 |           8 |      128 |        1 |               1 |       8 |           0 | 300.00 |            0 |                          55.43 |                       54.97 |         0.00 |                                                     707154.00 |                                             144014.00 |

#### Per Phase

| DBMS             | phase            |   experiment_run |   terminals |   target |   benchmark_run |   pod_count |   tenant_id |   time |   num_errors |   Throughput (requests/second) |   Goodput (requests/second) |   efficiency |   Latency Distribution.95th Percentile Latency (microseconds) |   Latency Distribution.Average Latency (microseconds) |
|:-----------------|:-----------------|-----------------:|------------:|---------:|----------------:|------------:|------------:|-------:|-------------:|-------------------------------:|----------------------------:|-------------:|--------------------------------------------------------------:|------------------------------------------------------:|
| PostgreSQL-1-1-1 | PostgreSQL-1-1-1 |                1 |          64 |     1024 |               1 |           8 |           0 | 300.00 |            2 |                         442.83 |                      438.92 |         0.00 |                                                     741875.00 |                                             144349.62 |

### Monitoring

### Loading phase: SUT deployment

| DBMS               |   CPU [CPUs] |   Max CPU |   Max RAM [Gb] |   Max RAM Cached [Gb] |
|:-------------------|-------------:|----------:|---------------:|----------------------:|
| PostgreSQL-1-1-1-1 |        31.87 |      0.79 |           0.50 |                  0.65 |

### Loading phase: component loader

| DBMS               |   CPU [CPUs] |   Max CPU |   Max RAM [Gb] |   Max RAM Cached [Gb] |
|:-------------------|-------------:|----------:|---------------:|----------------------:|
| PostgreSQL-1-1-1-1 |         0.02 |      0.00 |           0.00 |                  0.00 |

### Execution phase: SUT deployment

| DBMS               |   CPU [CPUs] |   Max CPU |   Max RAM [Gb] |   Max RAM Cached [Gb] |
|:-------------------|-------------:|----------:|---------------:|----------------------:|
| PostgreSQL-1-1-1-1 |       743.38 |      2.83 |           0.91 |                  1.19 |

### Execution phase: component benchmarker

| DBMS               |   CPU [CPUs] |   Max CPU |   Max RAM [Gb] |   Max RAM Cached [Gb] |
|:-------------------|-------------:|----------:|---------------:|----------------------:|
| PostgreSQL-1-1-1-1 |       214.79 |      0.90 |           0.26 |                  0.26 |

### Tests
* TEST passed: Loading phase: SUT deployment contains no 0 or NaN in CPU [CPUs]
* TEST passed: Loading phase: component loader contains no 0 or NaN in CPU [CPUs]
* TEST passed: Execution phase: SUT deployment contains no 0 or NaN in CPU [CPUs]
* TEST passed: Execution phase: component benchmarker contains no 0 or NaN in CPU [CPUs]
* TEST passed: Throughput (requests/second) contains no 0 or NaN
* TEST passed: Workflow as planned
The Execution table reports:
Throughput (requests/second)andGoodput (requests/second)— total and successful transaction rateLatency Distribution.95th Percentile Latency (microseconds)— tail latencyefficiency— how close actual throughput came to the target
HammerDB (TPC-C)
HammerDB runs TPC-C using virtual users (vusers).
Configurations are numbered sequentially per DBMS — PostgreSQL-1, PostgreSQL-2, etc.
Start DBMS
bexhoma hammerdb \
  -dbms PostgreSQL \
  -m \
  -mc \
  -ms $BEXHOMA_MS \
  -tr \
  -lr 64Gi \
  -rr 64Gi \
  -rnn $BEXHOMA_NODE_SUT \
  start &>$LOG_DIR/docs_hammerdb_postgresql_start.log
docs_hammerdb_postgresql_start.log
## Show Summary

### Workload
HammerDB Start DBMS
* Type: tpcc
* Duration: 193s
* Code: 1782747652
* Start DBMS and do not load data.
* This just starts a SUT.
  * Experiment uses bexhoma version 0.10.2.
  * System metrics are monitored by a cluster-wide installation.
  * Experiment is limited to DBMS ['PostgreSQL'].
  * SUT is fixed to cl-worker38.
  * Experiment is run once.

### Services
PostgreSQL-1
* kubectl --context oidc_ds_cluster port-forward service/bexhoma-sut-postgresql-1-1782747652 9091:9091

### Connections
* PostgreSQL-1-1 uses docker image postgres:18.3
  * RAM:540492877824
  * CPU:Intel(R) Xeon(R) Gold 6430
  * Cores:128
  * host:6.8.0-111-generic
  * node:cl-worker38
  * disk:263525
  * datadisk:39
  * cpu_list:0-127
  * args:['-c', 'max_connections=640', '-c', 'max_worker_processes=16', '-c', 'max_parallel_workers=16', '-c', 'max_parallel_workers_per_gather=8', '-c', 'max_parallel_maintenance_workers=4', '-c', 'shared_buffers=16GB', '-c', 'effective_cache_size=40GB', '-c', 'work_mem=512MB', '-c', 'maintenance_work_mem=2GB', '-c', 'autovacuum=off', '-c', 'wal_level=minimal', '-c', 'max_wal_senders=0', '-c', 'max_wal_size=32GB', '-c', 'checkpoint_timeout=1h', '-c', 'checkpoint_completion_target=1.0', '-c', 'lock_timeout=30s', '-c', 'idle_in_transaction_session_timeout=30000']
  * requests_cpu:4
  * requests_memory:16Gi
  * eval_parameters
    * code:1782747652

### Tests
Start DBMS and Load Data
Imports TPC-C data (1 warehouse = scale factor 1) using a single loader pod.
HammerDB’s loader is inherently single-threaded, so -nlp 1 -nlt 1 is typical.
bexhoma hammerdb \
  -dbms PostgreSQL \
  -nlp 1 \
  -nlt 1 \
  -m \
  -mc \
  -ms $BEXHOMA_MS \
  -tr \
  -lr 64Gi \
  -rr 64Gi \
  -rss 50Gi \
  -rnn $BEXHOMA_NODE_SUT -rnl $BEXHOMA_NODE_LOAD \
  load &>$LOG_DIR/docs_hammerdb_postgresql_load.log
docs_hammerdb_postgresql_load.log
## Show Summary

### Workload
HammerDB Data Loading SF=1 (warehouses for TPC-C)
* Type: tpcc
* Duration: 267s
* Code: 1782747873
* HammerDB runs the benchmark.
* This imports TPC-C data sets.
  * TPC-C data is generated and loaded using several threads.
  * Scaling factor (i.e., number of warehouses) is 1.
  * Experiment uses bexhoma version 0.10.2.
  * System metrics are monitored by a cluster-wide installation.
  * Experiment is limited to DBMS ['PostgreSQL'].
  * Import is handled by 1 processes (pods).
  * Loading is fixed to cl-worker19.
  * SUT is fixed to cl-worker38.
  * Loading is tested with [1] threads, split into [1] pods.
  * Experiment is run once.

### Services
PostgreSQL-1
* kubectl --context oidc_ds_cluster port-forward service/bexhoma-sut-postgresql-1-1782747873 9091:9091

### Connections
* PostgreSQL-1-1 uses docker image postgres:18.3
  * RAM:540492877824
  * CPU:Intel(R) Xeon(R) Gold 6430
  * Cores:128
  * host:6.8.0-111-generic
  * node:cl-worker38
  * disk:263766
  * datadisk:280
  * cpu_list:0-127
  * args:['-c', 'max_connections=640', '-c', 'max_worker_processes=16', '-c', 'max_parallel_workers=16', '-c', 'max_parallel_workers_per_gather=8', '-c', 'max_parallel_maintenance_workers=4', '-c', 'shared_buffers=16GB', '-c', 'effective_cache_size=40GB', '-c', 'work_mem=512MB', '-c', 'maintenance_work_mem=2GB', '-c', 'autovacuum=off', '-c', 'wal_level=minimal', '-c', 'max_wal_senders=0', '-c', 'max_wal_size=32GB', '-c', 'checkpoint_timeout=1h', '-c', 'checkpoint_completion_target=1.0', '-c', 'lock_timeout=30s', '-c', 'idle_in_transaction_session_timeout=30000']
  * requests_cpu:4
  * requests_memory:16Gi
  * eval_parameters
    * code:1782747873

### Loading

#### Per Run

|                |   experiment_run |   SF |   time_load |   time_preload |   time_generate |   time_ingest |   time_postload |   loading_pods |   terminals | tenant_id   | type_tenants   |   num_tenants | vol_tenants   |   Throughput [SF/h] |
|:---------------|-----------------:|-----:|------------:|---------------:|----------------:|--------------:|----------------:|---------------:|------------:|:------------|:---------------|--------------:|:--------------|--------------------:|
| PostgreSQL-1-1 |                1 |    1 |       59.00 |           0.00 |            0.00 |         26.00 |           33.00 |              1 |           1 |             | None           |             0 | False         |               61.02 |

### Monitoring

### Loading phase: SUT deployment

| DBMS           |   CPU [CPUs] |   Max CPU |   Max RAM [Gb] |   Max RAM Cached [Gb] |
|:---------------|-------------:|----------:|---------------:|----------------------:|
| PostgreSQL-1-1 |         1.03 |      0.06 |           0.42 |                  0.46 |

### Loading phase: component loader

| DBMS           |   CPU [CPUs] |   Max CPU |   Max RAM [Gb] |   Max RAM Cached [Gb] |
|:---------------|-------------:|----------:|---------------:|----------------------:|
| PostgreSQL-1-1 |        12.18 |      0.00 |           0.02 |                  0.02 |

### Tests
* TEST passed: Loading phase: SUT deployment contains no 0 or NaN in CPU [CPUs]
* TEST passed: Loading phase: component loader contains no 0 or NaN in CPU [CPUs]
The Loading table reports Imported warehouses [1/h].
Start DBMS and Load Data and Run Workload
Loads data and runs TPC-C for 5 minutes with 64 virtual users.
bexhoma hammerdb \
  -dbms PostgreSQL \
  -nlp 1 \
  -nlt 1 \
  -nbp 1 \
  -nbt 64 \
  -m \
  -mc \
  -ms $BEXHOMA_MS \
  -ss \
  -tr \
  -lr 64Gi \
  -rr 64Gi \
  -rss 50Gi \
  -rnn $BEXHOMA_NODE_SUT -rnl $BEXHOMA_NODE_LOAD -rnb $BEXHOMA_NODE_BENCHMARK \
  run &>$LOG_DIR/docs_hammerdb_postgresql_run.log
docs_hammerdb_postgresql_run.log
## Show Summary

### Workload
HammerDB Workload SF=1 (warehouses for TPC-C)
* Type: tpcc
* Duration: 729s
* Code: 1782748178
* HammerDB runs the benchmark.
* This experiment compares run time and resource consumption of TPC-C queries in different DBMS.
  * TPC-C data is generated and loaded using several threads.
  * Scaling factor (i.e., number of warehouses) is 1. Benchmarking runs for 5 minutes.
  * Experiment uses bexhoma version 0.10.2.
  * System metrics are monitored by a cluster-wide installation.
  * Experiment is limited to DBMS ['PostgreSQL'].
  * Import is handled by 1 processes (pods).
  * Loading is fixed to cl-worker19.
  * Benchmarking is fixed to cl-worker19.
  * SUT is fixed to cl-worker38.
  * Loading is tested with [1] threads, split into [1] pods.
  * Benchmarking is tested with [64] threads, split into [1] pods.
  * Benchmarking is run as [1] times the number of benchmarking pods.
  * Experiment is run once.

### Connections
* PostgreSQL-1-1-1-1 uses docker image postgres:18.3
  * RAM:540492877824
  * CPU:Intel(R) Xeon(R) Gold 6430
  * Cores:128
  * host:6.8.0-111-generic
  * node:cl-worker38
  * disk:263766
  * datadisk:280
  * cpu_list:0-127
  * args:['-c', 'max_connections=640', '-c', 'max_worker_processes=16', '-c', 'max_parallel_workers=16', '-c', 'max_parallel_workers_per_gather=8', '-c', 'max_parallel_maintenance_workers=4', '-c', 'shared_buffers=16GB', '-c', 'effective_cache_size=40GB', '-c', 'work_mem=512MB', '-c', 'maintenance_work_mem=2GB', '-c', 'autovacuum=off', '-c', 'wal_level=minimal', '-c', 'max_wal_senders=0', '-c', 'max_wal_size=32GB', '-c', 'checkpoint_timeout=1h', '-c', 'checkpoint_completion_target=1.0', '-c', 'lock_timeout=30s', '-c', 'idle_in_transaction_session_timeout=30000']
  * requests_cpu:4
  * requests_memory:16Gi
  * eval_parameters
    * code:1782748178

### Workflow

#### Actual

* DBMS PostgreSQL-1 - Experiment 1 Client 1: hammerdb (1 pods)

#### Planned

* DBMS PostgreSQL-1 - Experiment 1 Client 1: hammerdb (1 pods)

### Loading

#### Per Run

|                |   experiment_run |   SF |   time_load |   time_preload |   time_generate |   time_ingest |   time_postload |   loading_pods |   terminals | tenant_id   | type_tenants   |   num_tenants | vol_tenants   |   Throughput [SF/h] |
|:---------------|-----------------:|-----:|------------:|---------------:|----------------:|--------------:|----------------:|---------------:|------------:|:------------|:---------------|--------------:|:--------------|--------------------:|
| PostgreSQL-1-1 |                1 |    1 |       62.00 |           1.00 |            0.00 |         26.00 |           35.00 |              1 |           1 |             | None           |             0 | False         |               58.06 |

### Execution

#### Per Connection

| DBMS                 | phase            | job                |   experiment_run |   vusers |   client |   benchmark_run |   child |   NOPM |   TPM |   efficiency |   duration |   errors |
|:---------------------|:-----------------|:-------------------|-----------------:|---------:|---------:|----------------:|--------:|-------:|------:|-------------:|-----------:|---------:|
| PostgreSQL-1-1-1-1-1 | PostgreSQL-1-1-1 | PostgreSQL-1-1-1-1 |                1 |       64 |        1 |               1 |       1 |  39278 | 90268 |         0.00 |          5 |        0 |

#### Per Phase

| DBMS             | phase            |   experiment_run |   vusers |   client |   benchmark_run |   pod_count |   efficiency |     NOPM |      TPM |   duration |   errors |
|:-----------------|:-----------------|-----------------:|---------:|---------:|----------------:|------------:|-------------:|---------:|---------:|-----------:|---------:|
| PostgreSQL-1-1-1 | PostgreSQL-1-1-1 |                1 |       64 |        1 |               1 |           1 |         0.00 | 39278.00 | 90268.00 |          5 |        0 |

### Monitoring

### Loading phase: SUT deployment

| DBMS               |   CPU [CPUs] |   Max CPU |   Max RAM [Gb] |   Max RAM Cached [Gb] |
|:-------------------|-------------:|----------:|---------------:|----------------------:|
| PostgreSQL-1-1-1-1 |         0.00 |      0.01 |           0.39 |                  0.42 |

### Loading phase: component loader

| DBMS               |   CPU [CPUs] |   Max CPU |   Max RAM [Gb] |   Max RAM Cached [Gb] |
|:-------------------|-------------:|----------:|---------------:|----------------------:|
| PostgreSQL-1-1-1-1 |         0.02 |      0.00 |           0.00 |                  0.00 |

### Execution phase: SUT deployment

| DBMS               |   CPU [CPUs] |   Max CPU |   Max RAM [Gb] |   Max RAM Cached [Gb] |
|:-------------------|-------------:|----------:|---------------:|----------------------:|
| PostgreSQL-1-1-1-1 |      2496.30 |      6.17 |           1.62 |                  2.32 |

### Execution phase: component benchmarker

| DBMS               |   CPU [CPUs] |   Max CPU |   Max RAM [Gb] |   Max RAM Cached [Gb] |
|:-------------------|-------------:|----------:|---------------:|----------------------:|
| PostgreSQL-1-1-1-1 |        89.07 |      0.35 |           0.23 |                  0.24 |

### Tests
* TEST failed: Loading phase: SUT deployment contains 0 or NaN in CPU [CPUs]
* TEST passed: Loading phase: component loader contains no 0 or NaN in CPU [CPUs]
* TEST passed: Execution phase: SUT deployment contains no 0 or NaN in CPU [CPUs]
* TEST passed: Execution phase: component benchmarker contains no 0 or NaN in CPU [CPUs]
* TEST passed: NOPM contains no 0 or NaN
* TEST passed: Workflow as planned
The Execution table reports NOPM (New Orders Per Minute) and TPM (Transactions Per Minute), which are the standard HammerDB TPC-C metrics.
TPC-H
TPC-H is the standard analytical benchmark with 22 queries.
Data is generated by a loader pod using dbgen, then loaded into the SUT.
After loading, the DBMSBenchmarker tool runs the 22 queries and records per-query latency.
Start DBMS
bexhoma tpch \
  -dbms PostgreSQL \
  -m \
  -mc \
  -ms $BEXHOMA_MS \
  -tr \
  -lr 64Gi \
  -rr 64Gi \
  -rnn $BEXHOMA_NODE_SUT \
  start &>$LOG_DIR/docs_tpch_postgresql_start.log
docs_tpch_postgresql_start.log
## Show Summary

### Workload
TPC-H Start DBMS
* Type: tpch
* Duration: 195s
* Code: 1782748949
* Start DBMS and do not load data.
* This just starts a SUT.
  * Experiment uses bexhoma version 0.10.2.
  * System metrics are monitored by a cluster-wide installation.
  * Experiment is limited to DBMS ['PostgreSQL'].
  * SUT is fixed to cl-worker38.
  * Experiment is run once.

### Services
PostgreSQL-1
* kubectl --context oidc_ds_cluster port-forward service/bexhoma-sut-postgresql-1-1782748949 9091:9091

### Connections
* PostgreSQL-1-1 uses docker image postgres:18.3
  * RAM:540492877824
  * CPU:Intel(R) Xeon(R) Gold 6430
  * Cores:128
  * host:6.8.0-111-generic
  * node:cl-worker38
  * disk:263525
  * datadisk:39
  * cpu_list:0-127
  * args:['-c', 'max_connections=640', '-c', 'max_worker_processes=16', '-c', 'max_parallel_workers=16', '-c', 'max_parallel_workers_per_gather=8', '-c', 'max_parallel_maintenance_workers=4', '-c', 'shared_buffers=16GB', '-c', 'effective_cache_size=40GB', '-c', 'work_mem=512MB', '-c', 'maintenance_work_mem=2GB', '-c', 'autovacuum=off', '-c', 'wal_level=minimal', '-c', 'max_wal_senders=0', '-c', 'max_wal_size=32GB', '-c', 'checkpoint_timeout=1h', '-c', 'checkpoint_completion_target=1.0', '-c', 'lock_timeout=30s', '-c', 'idle_in_transaction_session_timeout=30000']
  * requests_cpu:4
  * requests_memory:16Gi
  * eval_parameters
    * code:1782748949

### Tests
Start DBMS and Load Data
Generates and loads TPC-H data at scale factor 1.
The flags -xii -xic -xis trigger index creation, constraint application, and statistics gathering after the raw data is ingested.
bexhoma tpch \
  -dbms PostgreSQL \
  -nlp 1 \
  -nlt 1 \
  -xii -xic -xis \
  -m \
  -mc \
  -ms $BEXHOMA_MS \
  -tr \
  -lr 64Gi \
  -rr 64Gi \
  -rss 50Gi \
  -rnn $BEXHOMA_NODE_SUT -rnl $BEXHOMA_NODE_LOAD \
  load &>$LOG_DIR/docs_tpch_postgresql_load.log
docs_tpch_postgresql_load.log
## Show Summary

### Workload
TPC-H Data Loading SF=1
* Type: tpch
* Duration: 307s
* Code: 1782749172
* This includes the reading queries of TPC-H.
* This imports TPC-H data sets.
  * TPC-H (SF=1) data is loaded and benchmark is executed.
  * Import sets indexes and constraints after loading and recomputes statistics.
  * Experiment uses bexhoma version 0.10.2.
  * System metrics are monitored by a cluster-wide installation.
  * Experiment is limited to DBMS ['PostgreSQL'].
  * Import is handled by 1 processes (pods).
  * Loading is fixed to cl-worker19.
  * SUT is fixed to cl-worker38.
  * Loading is tested with [1] threads, split into [1] pods.
  * Experiment is run once.

### Services
PostgreSQL-1
* kubectl --context oidc_ds_cluster port-forward service/bexhoma-sut-postgresql-1-1782749172 9091:9091

### Connections
* PostgreSQL-1-1 uses docker image postgres:18.3
  * RAM:540492877824
  * CPU:Intel(R) Xeon(R) Gold 6430
  * Cores:128
  * host:6.8.0-111-generic
  * node:cl-worker38
  * disk:266243
  * datadisk:2757
  * cpu_list:0-127
  * args:['-c', 'max_connections=640', '-c', 'max_worker_processes=16', '-c', 'max_parallel_workers=16', '-c', 'max_parallel_workers_per_gather=8', '-c', 'max_parallel_maintenance_workers=4', '-c', 'shared_buffers=16GB', '-c', 'effective_cache_size=40GB', '-c', 'work_mem=512MB', '-c', 'maintenance_work_mem=2GB', '-c', 'autovacuum=off', '-c', 'wal_level=minimal', '-c', 'max_wal_senders=0', '-c', 'max_wal_size=32GB', '-c', 'checkpoint_timeout=1h', '-c', 'checkpoint_completion_target=1.0', '-c', 'lock_timeout=30s', '-c', 'idle_in_transaction_session_timeout=30000']
  * requests_cpu:4
  * requests_memory:16Gi
  * eval_parameters
    * code:1782749172

### Loading

#### Per Run

|                |   experiment_run |   SF |   time_load |   time_preload |   time_generate |   time_ingest |   time_postload |   loading_pods |   terminals | tenant_id   | type_tenants   |   num_tenants | vol_tenants   |   Throughput [SF/h] |
|:---------------|-----------------:|-----:|------------:|---------------:|----------------:|--------------:|----------------:|---------------:|------------:|:------------|:---------------|--------------:|:--------------|--------------------:|
| PostgreSQL-1-1 |                1 |    1 |      124.00 |           1.00 |            0.00 |         35.00 |           86.00 |              1 |           0 |             |                |             0 | False         |               29.03 |

### Monitoring

### Loading phase: SUT deployment

| DBMS           |   CPU [CPUs] |   Max CPU |   Max RAM [Gb] |   Max RAM Cached [Gb] |
|:---------------|-------------:|----------:|---------------:|----------------------:|
| PostgreSQL-1-1 |        22.93 |      0.39 |           0.50 |                  1.72 |

### Loading phase: component data generator

| DBMS           |   CPU [CPUs] |   Max CPU |   Max RAM [Gb] |   Max RAM Cached [Gb] |
|:---------------|-------------:|----------:|---------------:|----------------------:|
| PostgreSQL-1-1 |         0.00 |      0.00 |           0.00 |                  0.00 |

### Loading phase: component loader

| DBMS           |   CPU [CPUs] |   Max CPU |   Max RAM [Gb] |   Max RAM Cached [Gb] |
|:---------------|-------------:|----------:|---------------:|----------------------:|
| PostgreSQL-1-1 |         9.30 |      0.31 |           0.00 |                  0.89 |

### Tests
* TEST passed: Loading phase: SUT deployment contains no 0 or NaN in CPU [CPUs]
* TEST skipped: Loading phase: component data generator contains 0 or NaN in CPU [CPUs] (data pre-existing)
* TEST passed: Loading phase: component loader contains no 0 or NaN in CPU [CPUs]
The Loading table breaks down time into phases:
Column |
Meaning |
|---|---|
|
Time to generate raw data files with |
|
Time to import data into the DBMS |
|
Time to apply schema (DDL) |
|
Time to create indexes and constraints |
|
Total loading time |
Start DBMS and Load Data and Run Workload
Loads TPC-H data and runs all 22 queries once.
bexhoma tpch \
  -dbms PostgreSQL \
  -nlp 1 \
  -nlt 1 \
  -nbp 1 \
  -nbt 64 \
  -xii -xic -xis \
  -m \
  -mc \
  -ms $BEXHOMA_MS \
  -ss \
  -tr \
  -lr 64Gi \
  -rr 64Gi \
  -rss 50Gi \
  -rnn $BEXHOMA_NODE_SUT -rnl $BEXHOMA_NODE_LOAD -rnb $BEXHOMA_NODE_BENCHMARK \
  run &>$LOG_DIR/docs_tpch_postgresql_run.log
docs_tpch_postgresql_run.log
## Show Summary

### Workload
TPC-H Queries SF=1
* Type: tpch
* Duration: 367s
* Code: 1782749530
* This includes the reading queries of TPC-H.
* This experiment compares run time and resource consumption of TPC-H queries in different DBMS.
  * TPC-H (SF=1) data is loaded and benchmark is executed.
  * Query ordering is Q1 - Q22.
  * All instances use the same query parameters.
  * Timeout per query is 600.
  * Import sets indexes and constraints after loading and recomputes statistics.
  * Experiment uses bexhoma version 0.10.2.
  * System metrics are monitored by a cluster-wide installation.
  * Experiment is limited to DBMS ['PostgreSQL'].
  * Import is handled by 1 processes (pods).
  * Loading is fixed to cl-worker19.
  * Benchmarking is fixed to cl-worker19.
  * SUT is fixed to cl-worker38.
  * Loading is tested with [1] threads, split into [1] pods.
  * Benchmarking is tested with [64] threads, split into [1] pods.
  * Benchmarking is run as [1] times the number of benchmarking pods.
  * Experiment is run once.

### Connections
* PostgreSQL-1-1-1-1-1 uses docker image postgres:18.3
  * RAM:540492877824
  * CPU:Intel(R) Xeon(R) Gold 6430
  * Cores:128
  * host:6.8.0-111-generic
  * node:cl-worker38
  * disk:266243
  * datadisk:2757
  * cpu_list:0-127
  * args:['-c', 'max_connections=640', '-c', 'max_worker_processes=16', '-c', 'max_parallel_workers=16', '-c', 'max_parallel_workers_per_gather=8', '-c', 'max_parallel_maintenance_workers=4', '-c', 'shared_buffers=16GB', '-c', 'effective_cache_size=40GB', '-c', 'work_mem=512MB', '-c', 'maintenance_work_mem=2GB', '-c', 'autovacuum=off', '-c', 'wal_level=minimal', '-c', 'max_wal_senders=0', '-c', 'max_wal_size=32GB', '-c', 'checkpoint_timeout=1h', '-c', 'checkpoint_completion_target=1.0', '-c', 'lock_timeout=30s', '-c', 'idle_in_transaction_session_timeout=30000']
  * requests_cpu:4
  * requests_memory:16Gi
  * eval_parameters
    * code:1782749530

### Workflow

#### Actual

* DBMS PostgreSQL-1 - Experiment 1 Client 1: tpch (1 pods)

#### Planned

* DBMS PostgreSQL-1 - Experiment 1 Client 1: tpch (1 pods)

### Loading

#### Per Run

|                |   experiment_run |   SF |   time_load |   time_preload |   time_generate |   time_ingest |   time_postload |   loading_pods |   terminals | tenant_id   | type_tenants   |   num_tenants | vol_tenants   |   Throughput [SF/h] |
|:---------------|-----------------:|-----:|------------:|---------------:|----------------:|--------------:|----------------:|---------------:|------------:|:------------|:---------------|--------------:|:--------------|--------------------:|
| PostgreSQL-1-1 |                1 |    1 |      125.00 |           1.00 |            0.00 |         34.00 |           88.00 |              1 |           0 |             |                |             0 | False         |               28.80 |

### Execution

#### Per Connection

|                      | configuration   | phase            | job                |   experiment_run |   client |   benchmark_run |   pod_count |   SF |   num_of_queries |   time [s] |   Geo Times [s] |   Power@Size [~Q/h] |   Throughput@Size |   tenant_id | pod                  |
|:---------------------|:----------------|:-----------------|:-------------------|-----------------:|---------:|----------------:|------------:|-----:|-----------------:|-----------:|----------------:|--------------------:|------------------:|------------:|:---------------------|
| PostgreSQL-1-1-1-1-1 | PostgreSQL-1    | PostgreSQL-1-1-1 | PostgreSQL-1-1-1-1 |                1 |        1 |               1 |           1 | 1.00 |               22 |         15 |            0.41 |             8846.41 |           5280.00 |           0 | PostgreSQL-1-1-1-1-1 |

#### Per Phase

|                  | phase            |   experiment_run |   client |   benchmark_run |   pod_count |   SF |   num_of_queries |   time [s] |   Geo Times [s] |   Power@Size [~Q/h] |   Throughput@Size |   tenant_id |
|:-----------------|:-----------------|-----------------:|---------:|----------------:|------------:|-----:|-----------------:|-----------:|----------------:|--------------------:|------------------:|------------:|
| PostgreSQL-1-1-1 | PostgreSQL-1-1-1 |                1 |        1 |               1 |           1 | 1.00 |               22 |         15 |            0.41 |             8846.41 |           5280.00 |           0 |

### Latency of Timer Execution [ms]
| Queries                                             |   PostgreSQL-1-1-1-1-1 |
|:----------------------------------------------------|-----------------------:|
| Pricing Summary Report (TPC-H Q1)                   |                1302.89 |
| Minimum Cost Supplier Query (TPC-H Q2)              |                 377.88 |
| Shipping Priority (TPC-H Q3)                        |                 537.18 |
| Order Priority Checking Query (TPC-H Q4)            |                 241.84 |
| Local Supplier Volume (TPC-H Q5)                    |                 528.98 |
| Forecasting Revenue Change (TPC-H Q6)               |                 269.17 |
| Volume Shipping Query (TPC-H Q7)                    |                 599.21 |
| National Market Share (TPC-H Q8)                    |                 311.33 |
| Product Type Profit Measure (TPC-H Q9)              |                 788.74 |
| Returned Item Reporting Query (TPC-H Q10)           |                 415.71 |
| Important Stock Identification (TPC-H Q11)          |                 141.29 |
| Shipping Modes and Order Priority (TPC-H Q12)       |                 401.06 |
| Customer Distribution (TPC-H Q13)                   |                1497.51 |
| Promotion Effect Query (TPC-H Q14)                  |                 314.56 |
| Top Supplier Query (TPC-H Q15)                      |                 313.48 |
| Parts/Supplier Relationship (TPC-H Q16)             |                 345.25 |
| Small-Quantity-Order Revenue (TPC-H Q17)            |                1134.93 |
| Large Volume Customer (TPC-H Q18)                   |                4108.00 |
| Discounted Revenue (TPC-H Q19)                      |                  61.53 |
| Potential Part Promotion (TPC-H Q20)                |                 134.39 |
| Suppliers Who Kept Orders Waiting Query (TPC-H Q21) |                 355.22 |
| Global Sales Opportunity Query (TPC-H Q22)          |                 116.56 |

### Errors (failed queries)

No errors

### Warnings (result mismatch)

No warnings

### Monitoring

### Loading phase: SUT deployment

| DBMS               |   CPU [CPUs] |   Max CPU |   Max RAM [Gb] |   Max RAM Cached [Gb] |
|:-------------------|-------------:|----------:|---------------:|----------------------:|
| PostgreSQL-1-1-1-1 |        35.96 |      0.53 |           1.81 |                  3.24 |

### Loading phase: component data generator

| DBMS               |   CPU [CPUs] |   Max CPU |   Max RAM [Gb] |   Max RAM Cached [Gb] |
|:-------------------|-------------:|----------:|---------------:|----------------------:|
| PostgreSQL-1-1-1-1 |         0.00 |      0.00 |           0.00 |                  0.00 |

### Loading phase: component loader

| DBMS               |   CPU [CPUs] |   Max CPU |   Max RAM [Gb] |   Max RAM Cached [Gb] |
|:-------------------|-------------:|----------:|---------------:|----------------------:|
| PostgreSQL-1-1-1-1 |         0.02 |      0.00 |           0.00 |                  0.00 |

### Execution phase: SUT deployment

| DBMS               |   CPU [CPUs] |   Max CPU |   Max RAM [Gb] |   Max RAM Cached [Gb] |
|:-------------------|-------------:|----------:|---------------:|----------------------:|
| PostgreSQL-1-1-1-1 |         0.00 |      0.61 |           1.70 |                  3.25 |

### Execution phase: component benchmarker

| DBMS               |   CPU [CPUs] |   Max CPU |   Max RAM [Gb] |   Max RAM Cached [Gb] |
|:-------------------|-------------:|----------:|---------------:|----------------------:|
| PostgreSQL-1-1-1-1 |         0.00 |      0.00 |           0.00 |                  0.00 |

### Tests
* TEST passed: Loading phase: SUT deployment contains no 0 or NaN in CPU [CPUs]
* TEST skipped: Loading phase: component data generator contains 0 or NaN in CPU [CPUs] (data pre-existing)
* TEST passed: Loading phase: component loader contains no 0 or NaN in CPU [CPUs]
* TEST failed: Execution phase: SUT deployment contains 0 or NaN in CPU [CPUs]
* TEST failed: Execution phase: component benchmarker contains 0 or NaN in CPU [CPUs]
* TEST passed: Geo Times [s] contains no 0 or NaN
* TEST passed: Power@Size [~Q/h] contains no 0 or NaN
* TEST passed: Throughput@Size contains no 0 or NaN
* TEST passed: No SQL errors
* TEST passed: No SQL warnings
* TEST passed: Workflow as planned
The Execution section reports per-query latency in the Latency of Timer Execution table and the TPC-H standard metrics:
Metric |
Meaning |
|---|---|
|
Geometric mean of per-query median runtimes |
|
TPC-H Power metric: |
|
TPC-H Throughput metric across all streams and queries |
TPC-DS
TPC-DS is the decision-support benchmark with 99 queries.
Its structure mirrors TPC-H: dbgen2 generates data, a loader imports it, DBMSBenchmarker runs the queries.
Start DBMS
bexhoma tpcds \
  -dbms PostgreSQL \
  -m \
  -mc \
  -ms $BEXHOMA_MS \
  -tr \
  -lr 64Gi \
  -rr 64Gi \
  -rnn $BEXHOMA_NODE_SUT \
  start &>$LOG_DIR/docs_tpcds_postgresql_start.log
docs_tpcds_postgresql_start.log
## Show Summary

### Workload
TPC-DS Start DBMS
* Type: tpcds
* Duration: 197s
* Code: 1782750014
* Start DBMS and do not load data.
* This just starts a SUT.
  * Experiment uses bexhoma version 0.10.2.
  * System metrics are monitored by a cluster-wide installation.
  * Experiment is limited to DBMS ['PostgreSQL'].
  * SUT is fixed to cl-worker38.
  * Experiment is run once.

### Services
PostgreSQL-1
* kubectl --context oidc_ds_cluster port-forward service/bexhoma-sut-postgresql-1-1782750014 9091:9091

### Connections
* PostgreSQL-1-1 uses docker image postgres:18.3
  * RAM:540492877824
  * CPU:Intel(R) Xeon(R) Gold 6430
  * Cores:128
  * host:6.8.0-111-generic
  * node:cl-worker38
  * disk:263525
  * datadisk:39
  * cpu_list:0-127
  * args:['-c', 'max_connections=640', '-c', 'max_worker_processes=16', '-c', 'max_parallel_workers=16', '-c', 'max_parallel_workers_per_gather=8', '-c', 'max_parallel_maintenance_workers=4', '-c', 'shared_buffers=16GB', '-c', 'effective_cache_size=40GB', '-c', 'work_mem=512MB', '-c', 'maintenance_work_mem=2GB', '-c', 'autovacuum=off', '-c', 'wal_level=minimal', '-c', 'max_wal_senders=0', '-c', 'max_wal_size=32GB', '-c', 'checkpoint_timeout=1h', '-c', 'checkpoint_completion_target=1.0', '-c', 'lock_timeout=30s', '-c', 'idle_in_transaction_session_timeout=30000']
  * requests_cpu:4
  * requests_memory:16Gi
  * eval_parameters
    * code:1782750014

### Tests
Start DBMS and Load Data
bexhoma tpcds \
  -dbms PostgreSQL \
  -nlp 1 \
  -nlt 1 \
  -xii -xic -xis \
  -m \
  -mc \
  -ms $BEXHOMA_MS \
  -tr \
  -lr 64Gi \
  -rr 64Gi \
  -rss 50Gi \
  -rnn $BEXHOMA_NODE_SUT -rnl $BEXHOMA_NODE_LOAD \
  load &>$LOG_DIR/docs_tpcds_postgresql_load.log
docs_tpcds_postgresql_load.log
## Show Summary

### Workload
TPC-DS Data Loading SF=1
* Type: tpcds
* Duration: 464s
* Code: 1782750237
* This includes the reading queries of TPC-DS.
* This imports TPC-DS data sets.
  * TPC-DS (SF=1) data is loaded and benchmark is executed.
  * Import sets indexes and constraints after loading and recomputes statistics.
  * Experiment uses bexhoma version 0.10.2.
  * System metrics are monitored by a cluster-wide installation.
  * Experiment is limited to DBMS ['PostgreSQL'].
  * Import is handled by 1 processes (pods).
  * Loading is fixed to cl-worker19.
  * SUT is fixed to cl-worker38.
  * Loading is tested with [1] threads, split into [1] pods.
  * Experiment is run once.

### Services
PostgreSQL-1
* kubectl --context oidc_ds_cluster port-forward service/bexhoma-sut-postgresql-1-1782750237 9091:9091

### Connections
* PostgreSQL-1-1 uses docker image postgres:18.3
  * RAM:540492877824
  * CPU:Intel(R) Xeon(R) Gold 6430
  * Cores:128
  * host:6.8.0-111-generic
  * node:cl-worker38
  * disk:269233
  * datadisk:5747
  * cpu_list:0-127
  * args:['-c', 'max_connections=640', '-c', 'max_worker_processes=16', '-c', 'max_parallel_workers=16', '-c', 'max_parallel_workers_per_gather=8', '-c', 'max_parallel_maintenance_workers=4', '-c', 'shared_buffers=16GB', '-c', 'effective_cache_size=40GB', '-c', 'work_mem=512MB', '-c', 'maintenance_work_mem=2GB', '-c', 'autovacuum=off', '-c', 'wal_level=minimal', '-c', 'max_wal_senders=0', '-c', 'max_wal_size=32GB', '-c', 'checkpoint_timeout=1h', '-c', 'checkpoint_completion_target=1.0', '-c', 'lock_timeout=30s', '-c', 'idle_in_transaction_session_timeout=30000']
  * requests_cpu:4
  * requests_memory:16Gi
  * eval_parameters
    * code:1782750237

### Loading

#### Per Run

|                |   experiment_run |   SF |   time_load |   time_preload |   time_generate |   time_ingest |   time_postload |   loading_pods |   terminals | tenant_id   | type_tenants   |   num_tenants | vol_tenants   |   Throughput [SF/h] |
|:---------------|-----------------:|-----:|------------:|---------------:|----------------:|--------------:|----------------:|---------------:|------------:|:------------|:---------------|--------------:|:--------------|--------------------:|
| PostgreSQL-1-1 |                1 |    1 |      394.00 |           1.00 |            0.00 |        159.00 |          232.00 |              1 |           0 |             | None           |             0 | False         |                9.14 |

### Monitoring

### Loading phase: SUT deployment

| DBMS           |   CPU [CPUs] |   Max CPU |   Max RAM [Gb] |   Max RAM Cached [Gb] |
|:---------------|-------------:|----------:|---------------:|----------------------:|
| PostgreSQL-1-1 |        89.00 |      0.82 |           2.02 |                  4.34 |

### Loading phase: component data generator

| DBMS           |   CPU [CPUs] |   Max CPU |   Max RAM [Gb] |   Max RAM Cached [Gb] |
|:---------------|-------------:|----------:|---------------:|----------------------:|
| PostgreSQL-1-1 |         0.00 |      0.00 |           0.00 |                  0.00 |

### Loading phase: component loader

| DBMS           |   CPU [CPUs] |   Max CPU |   Max RAM [Gb] |   Max RAM Cached [Gb] |
|:---------------|-------------:|----------:|---------------:|----------------------:|
| PostgreSQL-1-1 |        10.20 |      0.12 |           0.00 |                  1.00 |

### Tests
* TEST passed: Loading phase: SUT deployment contains no 0 or NaN in CPU [CPUs]
* TEST skipped: Loading phase: component data generator contains 0 or NaN in CPU [CPUs] (data pre-existing)
* TEST passed: Loading phase: component loader contains no 0 or NaN in CPU [CPUs]
Start DBMS and Load Data and Run Workload
Loads TPC-DS data and runs all 99 queries. Some queries may fail on certain DBMS (e.g., Q90 raises a division-by-zero on PostgreSQL at SF=1); these are flagged in the Errors section and in Tests.
bexhoma tpcds \
  -dbms PostgreSQL \
  -nlp 1 \
  -nlt 1 \
  -nbp 1 \
  -nbt 64 \
  -xii -xic -xis \
  -m \
  -mc \
  -ms $BEXHOMA_MS \
  -ss \
  -tr \
  -lr 64Gi \
  -rr 64Gi \
  -rss 50Gi \
  -rnn $BEXHOMA_NODE_SUT -rnl $BEXHOMA_NODE_LOAD -rnb $BEXHOMA_NODE_BENCHMARK \
  run &>$LOG_DIR/docs_tpcds_postgresql_run.log
docs_tpcds_postgresql_run.log
## Show Summary

### Workload
TPC-DS Queries SF=1
* Type: tpcds
* Duration: 726s
* Code: 1782750762
* This includes the reading queries of TPC-DS.
* This experiment compares run time and resource consumption of TPC-DS queries in different DBMS.
  * TPC-DS (SF=1) data is loaded and benchmark is executed.
  * Query ordering is Q1 - Q99.
  * All instances use the same query parameters.
  * Timeout per query is 600.
  * Import sets indexes and constraints after loading and recomputes statistics.
  * Experiment uses bexhoma version 0.10.2.
  * System metrics are monitored by a cluster-wide installation.
  * Experiment is limited to DBMS ['PostgreSQL'].
  * Import is handled by 1 processes (pods).
  * Loading is fixed to cl-worker19.
  * Benchmarking is fixed to cl-worker19.
  * SUT is fixed to cl-worker38.
  * Loading is tested with [1] threads, split into [1] pods.
  * Benchmarking is tested with [64] threads, split into [1] pods.
  * Benchmarking is run as [1] times the number of benchmarking pods.
  * Experiment is run once.

### Connections
* PostgreSQL-1-1-1-1-1 uses docker image postgres:18.3
  * RAM:540492877824
  * CPU:Intel(R) Xeon(R) Gold 6430
  * Cores:128
  * host:6.8.0-111-generic
  * node:cl-worker38
  * disk:269233
  * datadisk:5747
  * cpu_list:0-127
  * args:['-c', 'max_connections=640', '-c', 'max_worker_processes=16', '-c', 'max_parallel_workers=16', '-c', 'max_parallel_workers_per_gather=8', '-c', 'max_parallel_maintenance_workers=4', '-c', 'shared_buffers=16GB', '-c', 'effective_cache_size=40GB', '-c', 'work_mem=512MB', '-c', 'maintenance_work_mem=2GB', '-c', 'autovacuum=off', '-c', 'wal_level=minimal', '-c', 'max_wal_senders=0', '-c', 'max_wal_size=32GB', '-c', 'checkpoint_timeout=1h', '-c', 'checkpoint_completion_target=1.0', '-c', 'lock_timeout=30s', '-c', 'idle_in_transaction_session_timeout=30000']
  * requests_cpu:4
  * requests_memory:16Gi
  * eval_parameters
    * code:1782750762

### Workflow

#### Actual

* DBMS PostgreSQL-1 - Experiment 1 Client 1: tpcds (1 pods)

#### Planned

* DBMS PostgreSQL-1 - Experiment 1 Client 1: tpcds (1 pods)

### Loading

#### Per Run

|                |   experiment_run |   SF |   time_load |   time_preload |   time_generate |   time_ingest |   time_postload |   loading_pods |   terminals | tenant_id   | type_tenants   |   num_tenants | vol_tenants   |   Throughput [SF/h] |
|:---------------|-----------------:|-----:|------------:|---------------:|----------------:|--------------:|----------------:|---------------:|------------:|:------------|:---------------|--------------:|:--------------|--------------------:|
| PostgreSQL-1-1 |                1 |    1 |      405.00 |           1.00 |            0.00 |        173.00 |          230.00 |              1 |           0 |             | None           |             0 | False         |                8.89 |

### Execution

#### Per Connection

|                      | configuration   | phase            | job                |   experiment_run |   client |   benchmark_run |   pod_count |   SF |   num_of_queries |   time [s] |   Geo Times [s] |   Power@Size [~Q/h] |   Throughput@Size |   tenant_id | pod                  |
|:---------------------|:----------------|:-----------------|:-------------------|-----------------:|---------:|----------------:|------------:|-----:|-----------------:|-----------:|----------------:|--------------------:|------------------:|------------:|:---------------------|
| PostgreSQL-1-1-1-1-1 | PostgreSQL-1    | PostgreSQL-1-1-1 | PostgreSQL-1-1-1-1 |                1 |        1 |               1 |           1 | 1.00 |               99 |        221 |            0.44 |             8140.41 |           1612.67 |          -1 | PostgreSQL-1-1-1-1-1 |

#### Per Phase

|                  | phase            |   experiment_run |   client |   benchmark_run |   pod_count |   SF |   num_of_queries |   time [s] |   Geo Times [s] |   Power@Size [~Q/h] |   Throughput@Size |   tenant_id |
|:-----------------|:-----------------|-----------------:|---------:|----------------:|------------:|-----:|-----------------:|-----------:|----------------:|--------------------:|------------------:|------------:|
| PostgreSQL-1-1-1 | PostgreSQL-1-1-1 |                1 |        1 |               1 |           1 | 1.00 |               99 |        221 |            0.44 |             8140.41 |           1612.67 |          -1 |

### Latency of Timer Execution [ms]
| Queries       |   PostgreSQL-1-1-1-1-1 |
|:--------------|-----------------------:|
| TPC-DS Q1     |                 157.92 |
| TPC-DS Q2     |                 355.07 |
| TPC-DS Q3     |                 252.08 |
| TPC-DS Q4     |               10730.78 |
| TPC-DS Q5     |                 558.94 |
| TPC-DS Q6     |               64065.38 |
| TPC-DS Q7     |                 447.61 |
| TPC-DS Q8     |                  86.42 |
| TPC-DS Q9     |                3074.58 |
| TPC-DS Q10    |                1480.79 |
| TPC-DS Q11    |                7244.71 |
| TPC-DS Q12    |                  78.13 |
| TPC-DS Q13    |                 768.29 |
| TPC-DS Q14a+b |                2609.76 |
| TPC-DS Q15    |                 133.83 |
| TPC-DS Q16    |                 230.45 |
| TPC-DS Q17    |                 355.97 |
| TPC-DS Q18    |                 510.66 |
| TPC-DS Q19    |                 180.87 |
| TPC-DS Q20    |                 111.79 |
| TPC-DS Q21    |                 295.15 |
| TPC-DS Q22    |                4350.44 |
| TPC-DS Q23a+b |                6107.27 |
| TPC-DS Q24a+b |                 738.03 |
| TPC-DS Q25    |                 382.88 |
| TPC-DS Q26    |                 320.09 |
| TPC-DS Q27    |                  34.99 |
| TPC-DS Q28    |                 983.31 |
| TPC-DS Q29    |                 443.72 |
| TPC-DS Q30    |               11654.61 |
| TPC-DS Q31    |                1971.86 |
| TPC-DS Q32    |                 139.16 |
| TPC-DS Q33    |                 445.10 |
| TPC-DS Q34    |                  39.51 |
| TPC-DS Q35    |                1492.67 |
| TPC-DS Q36    |                  36.20 |
| TPC-DS Q37    |                 395.05 |
| TPC-DS Q38    |                1572.52 |
| TPC-DS Q39a+b |                3234.77 |
| TPC-DS Q40    |                 144.51 |
| TPC-DS Q41    |                1227.77 |
| TPC-DS Q42    |                 100.93 |
| TPC-DS Q43    |                 225.43 |
| TPC-DS Q44    |                 469.73 |
| TPC-DS Q45    |                 102.14 |
| TPC-DS Q46    |                  48.67 |
| TPC-DS Q47    |                2201.32 |
| TPC-DS Q48    |                 726.33 |
| TPC-DS Q49    |                 522.67 |
| TPC-DS Q50    |                 556.92 |
| TPC-DS Q51    |                1014.45 |
| TPC-DS Q52    |                 100.01 |
| TPC-DS Q53    |                 129.22 |
| TPC-DS Q54    |                 106.95 |
| TPC-DS Q55    |                  93.76 |
| TPC-DS Q56    |                 462.38 |
| TPC-DS Q57    |                1005.78 |
| TPC-DS Q58    |                 464.96 |
| TPC-DS Q59    |                 480.11 |
| TPC-DS Q60    |                 482.21 |
| TPC-DS Q61    |                 200.08 |
| TPC-DS Q62    |                 147.76 |
| TPC-DS Q63    |                 130.84 |
| TPC-DS Q64    |                 842.04 |
| TPC-DS Q65    |                 727.34 |
| TPC-DS Q66    |                 249.77 |
| TPC-DS Q67    |                3633.82 |
| TPC-DS Q68    |                  53.19 |
| TPC-DS Q69    |                 300.52 |
| TPC-DS Q70    |                 455.18 |
| TPC-DS Q71    |                 374.05 |
| TPC-DS Q72    |                1110.22 |
| TPC-DS Q73    |                  36.66 |
| TPC-DS Q74    |                1109.93 |
| TPC-DS Q75    |                 894.44 |
| TPC-DS Q76    |                 257.79 |
| TPC-DS Q77    |                 391.82 |
| TPC-DS Q78    |                1928.12 |
| TPC-DS Q79    |                 182.93 |
| TPC-DS Q80    |                 535.09 |
| TPC-DS Q81    |               51116.35 |
| TPC-DS Q82    |                 386.14 |
| TPC-DS Q83    |                 118.78 |
| TPC-DS Q84    |                 107.92 |
| TPC-DS Q85    |                 404.73 |
| TPC-DS Q86    |                 265.71 |
| TPC-DS Q87    |                1713.70 |
| TPC-DS Q88    |                3332.71 |
| TPC-DS Q89    |                 128.68 |
| TPC-DS Q90    |                 144.38 |
| TPC-DS Q91    |                 172.91 |
| TPC-DS Q92    |                  57.15 |
| TPC-DS Q93    |                 234.35 |
| TPC-DS Q94    |                 191.67 |
| TPC-DS Q95    |                4066.22 |
| TPC-DS Q96    |                 105.22 |
| TPC-DS Q97    |                 436.96 |
| TPC-DS Q98    |                 185.02 |
| TPC-DS Q99    |                 177.13 |

### Errors (failed queries)

No errors

### Warnings (result mismatch)

No warnings

### Monitoring

### Loading phase: SUT deployment

| DBMS               |   CPU [CPUs] |   Max CPU |   Max RAM [Gb] |   Max RAM Cached [Gb] |
|:-------------------|-------------:|----------:|---------------:|----------------------:|
| PostgreSQL-1-1-1-1 |       112.63 |      1.57 |           2.67 |                  5.34 |

### Loading phase: component data generator

| DBMS               |   CPU [CPUs] |   Max CPU |   Max RAM [Gb] |   Max RAM Cached [Gb] |
|:-------------------|-------------:|----------:|---------------:|----------------------:|
| PostgreSQL-1-1-1-1 |         0.00 |      0.00 |           0.00 |                  0.00 |

### Loading phase: component loader

| DBMS               |   CPU [CPUs] |   Max CPU |   Max RAM [Gb] |   Max RAM Cached [Gb] |
|:-------------------|-------------:|----------:|---------------:|----------------------:|
| PostgreSQL-1-1-1-1 |        11.43 |      0.11 |           0.00 |                  1.00 |

### Execution phase: SUT deployment

| DBMS               |   CPU [CPUs] |   Max CPU |   Max RAM [Gb] |   Max RAM Cached [Gb] |
|:-------------------|-------------:|----------:|---------------:|----------------------:|
| PostgreSQL-1-1-1-1 |       282.43 |      2.54 |           3.58 |                  6.26 |

### Execution phase: component benchmarker

| DBMS               |   CPU [CPUs] |   Max CPU |   Max RAM [Gb] |   Max RAM Cached [Gb] |
|:-------------------|-------------:|----------:|---------------:|----------------------:|
| PostgreSQL-1-1-1-1 |        13.21 |      0.61 |           0.30 |                  0.31 |

### Tests
* TEST passed: Loading phase: SUT deployment contains no 0 or NaN in CPU [CPUs]
* TEST skipped: Loading phase: component data generator contains 0 or NaN in CPU [CPUs] (data pre-existing)
* TEST passed: Loading phase: component loader contains no 0 or NaN in CPU [CPUs]
* TEST passed: Execution phase: SUT deployment contains no 0 or NaN in CPU [CPUs]
* TEST passed: Execution phase: component benchmarker contains no 0 or NaN in CPU [CPUs]
* TEST passed: Geo Times [s] contains no 0 or NaN
* TEST passed: Power@Size [~Q/h] contains no 0 or NaN
* TEST passed: Throughput@Size contains no 0 or NaN
* TEST passed: No SQL errors
* TEST passed: No SQL warnings
* TEST passed: Workflow as planned
The Execution section reports per-query latency for all 99 TPC-DS queries and the same Power@Size / Throughput@Size metrics as TPC-H.