Concept: Collectors
Overview
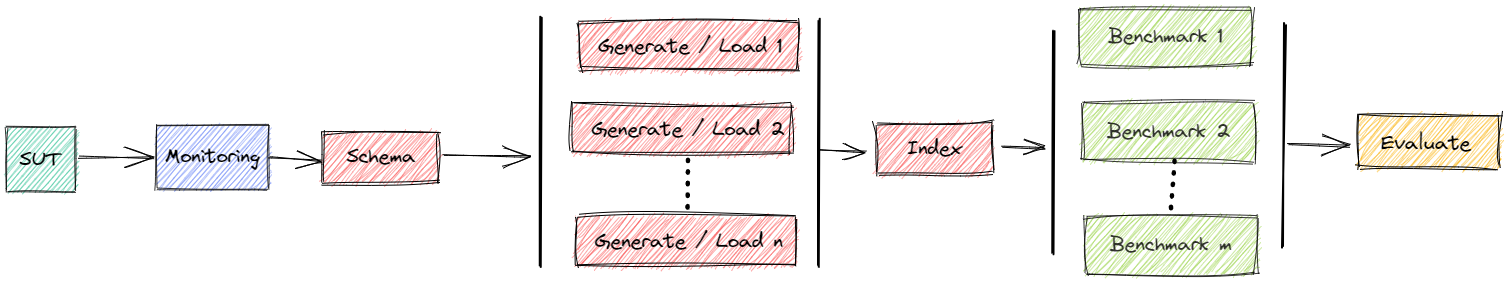
The collectors module aggregates results from one or more bexhoma experiments into a single, analysis-ready view.
Each collector wraps a benchmark-specific evaluator — the lower-level class that parses raw log files and result folders for a single experiment code.
collectors.benchbase(path, codes)        ← collector: spans N experiments
    └── get_evaluator(code)              ← evaluator: single experiment
            └── log parsing, DataFrames
Supported benchmark types:
Collector class |
Benchmark tool |
Evaluator class |
|---|---|---|
|
Benchbase |
|
|
HammerDB TPC-C |
|
|
YCSB |
|
|
DBMSBenchmarker |
|
|
Multiple tools in one experiment |
per-tool evaluator, selected automatically |
Concepts
Naming
The following terms identify the components of a bexhoma experiment result. Within a single experiment these identifiers carry no code prefix; the code prefix is added only in collectors, where results from multiple experiments are merged.
Term |
Description |
Example |
|---|---|---|
configuration |
Name of the SUT instance |
|
experiment_run |
Repeat counter for the whole experiment |
|
client |
1-based index of the benchmark phase within a run |
|
phase |
Benchmark phase identifier: |
|
benchmark_run |
1-based index of a parallel benchmark job within a phase |
|
job |
Benchmark job identifier: |
|
pod |
1-based index of a driver pod within a job |
|
connection |
Driver-pod identifier: |
|
In collectors, all job and connection identifiers are prefixed with the experiment code:
Collector-context identifier |
Pattern |
Example |
|---|---|---|
code-prefixed phase |
|
|
code-prefixed job |
|
|
code-prefixed connection |
|
|
Most experiments run a single benchmark job per phase (benchmark_run = 1), in which
case the job identifier PostgreSQL-1-2-3-1 is the only job for phase PostgreSQL-1-2-3.
Aggregation
Parallel pods within a job are aggregated into one row per job. Metric type determines the aggregation function:
Metric type |
Aggregation |
|---|---|
|
|
|
|
others |
|
Multi-tenancy adds a further dimension: a single service provider may map to several configurations (container instances). Dedicated _multitenant methods aggregate across tenants before returning results.
Quick Reference
Configuration & Metadata
Method |
Returns |
Index |
|---|---|---|
|
Connection metadata for all experiments |
connection name |
|
Hardware metric definitions (title, type, active) |
metric key |
|
Components monitored in the workload config |
component key |
|
Raw workload properties dict |
— |
|
Benchmark-specific evaluator for one experiment |
— |
Monitoring — Aggregated
Method |
Returns |
Index |
|---|---|---|
|
One scalar per metric per phase (all jobs merged) |
phase name |
|
One scalar per metric per job (jobs kept separate) |
job name |
|
Per-job aggregation, additionally grouped across tenants |
|
Monitoring — Time Series
Method |
Format |
Index |
|---|---|---|
|
Wide — columns are pod instances |
timestamp |
|
Wide transposed — rows are pod instances |
pod/instance |
|
Long — all codes stacked |
enumerated |
|
Long — all codes, tenant-annotated |
enumerated |
Performance — Benchmarking
Method |
Returns |
Index |
|---|---|---|
|
Unaggregated per-pod results, all codes |
connection name |
|
Aggregated per phase (all jobs in a phase merged) |
phase name |
|
Aggregated per job (jobs in a phase kept separate) |
job name |
|
Per-job aggregation with tenant metadata columns |
job name |
Performance — Loading
Method |
Returns |
Index |
|---|---|---|
|
Per-pod loading metrics, all codes |
connection name |
|
Per-connection loading metrics, all codes |
connection name |
|
Loading metrics aggregated per experiment run |
connection name |
|
Loading metrics per run with tenant metadata |
connection name |
Utility
Method |
Description |
|---|---|
|
Joins connection metadata onto any monitoring DataFrame |
|
Drops constant columns — highlights parameters that vary |
Class collector
Constructor
collect = collectors.benchbase(path, codes)
path— filesystem path containing the experiment result directories.codes— list of experiment codes to aggregate, e.g.["1776751747", "1776754749"].
The constructor reads connections.config from the first code to build the metrics metadata table.
An optional benchmark_run parameter (default 0) filters all result methods to a single benchmark session; 0 includes all sessions.
For experiments that ran multiple benchmark tools in sequence, use collectors.mixed instead — see the dedicated section below.
Configuration & Metadata
get_connections()
Returns a DataFrame of connection metadata for all experiments.
Columns include: phase (code-prefixed phase identifier: <code>-<configuration>-<experiment_run>-<client>), job (code-prefixed job identifier: <code>-<configuration>-<experiment_run>-<client>-<benchmark_run>), code, connection, configuration, experiment_run, benchmark_run, client, type_tenants, num_tenants, vol_tenants.
get_metrics_metadata()
Returns a DataFrame listing all hardware metrics defined in the experiment, with columns title, active, type, metric.
get_monitored_components(code='')
Returns a DataFrame of monitored component roles (e.g. loading, stream, database) with a description column.
get_evaluator(code='')
Returns the benchmark-specific evaluator for the given experiment code. Used internally but also useful for ad-hoc access to single-experiment data.
Monitoring — Aggregated
get_monitoring_aggregated_per_job(component='stream')
Returns one row per benchmark job across all codes. Each metric column is reduced to a scalar using the metric-type aggregation rule (counter → sum of deltas, ratio → max, other → mean). Index is the code-prefixed job identifier.
get_monitoring_aggregated_per_phase(component='stream')
Returns one row per phase across all codes. Calls get_monitoring_aggregated_per_job() and further reduces by grouping on (code, configuration, experiment_run, client), collapsing all parallel jobs within a phase. Aggregation rules: ratio → max, counter → sum, other → mean. Index is the code-prefixed phase identifier.
get_monitoring_aggregated_per_phase_multitenant(component='stream')
Extends get_monitoring_aggregated_per_job() by grouping across tenants. Ratio metrics are reduced with max; counter metrics with sum (except Total I/O Wait Time, which uses max). Index is the underscore-joined group key.
Monitoring — Time Series
get_monitoring_timeseries_single(code, metric='pg_locks_count', component='stream')
Returns a wide-format DataFrame for one metric in one experiment. Rows are timestamps; columns are monitored pod instances.
get_monitoring_timeseries_per_phase(code, metric='pg_locks_count', component='stream')
Same data as above, transposed: rows are pod instances, columns are timestamps.
get_monitoring_timeseries_all(metric='pg_locks_count', component='stream')
Collects long-format time-series across all codes. Columns include timestamp, value, code, phase, experiment_run, client, type_tenants, num_tenants, vol_tenants, metric, component. Values are summed across parallel pods.
get_monitoring_timeseries_all_multitenant(metric='pg_locks_count', component='stream')
Like get_monitoring_timeseries_all but annotates each row with tenant metadata from the workload config. For non-container tenancy the tenant column is set to "0".
Performance — Benchmarking
get_performance_per_connection()
Unaggregated per-pod results concatenated across all codes. Job, connection, and configuration columns are prefixed with the experiment code.
get_performance_aggregated_per_job()
Aggregates parallel pods within each job, then concatenates all codes. Groups by the job identifier (configuration-experiment_run-client-benchmark_run), producing one row per benchmark job. Index is the code-prefixed job identifier.
get_performance_aggregated_per_phase()
Aggregates parallel pods and all parallel jobs within each phase, then concatenates all codes. Groups by the phase identifier (configuration-experiment_run-client), collapsing all benchmark_run values. Index is the code-prefixed phase identifier.
get_performance_aggregated_per_phase_multitenant()
Per-job aggregation with tenant metadata. Adds type_tenants, num_tenants, and vol_tenants columns from the workload configuration. Groups by (code, experiment_run, client, benchmark_run, type_tenants, num_tenants), producing one row per job within each tenant group.
Performance — Loading
get_loading_per_pod()
Raw loading metrics for each individual pod across all codes.
get_loading_per_connection()
Loading metrics aggregated at connection level across all codes.
get_loading_per_run()
Loading metrics further aggregated per experiment run (one row per code-configuration-experiment_run).
get_loading_per_run_multitenant()
Same as above but fetches the multi-tenant variant from the evaluator, which includes tenant metadata columns.
Utility
add_metadata(df)
Enriches a DataFrame with connection metadata by attempting four join strategies in order:
Index ×
jobcolumn — whendf’s index intersectsdf_connections['job']. Used for per-job monitoring DataFrames (fromget_monitoring_aggregated_per_job()) whose index is the code-prefixed job identifier. Each job has a distinct identifier, so parallel benchmark jobs are correctly distinguished.Shared index — when
df’s index intersectsdf_connections’s index.phasecolumn join — when both DataFrames have aphasecolumn. Used for merged performance + monitoring DataFrames where results are already aggregated to phase granularity.Multi-tenant key join on
(code, experiment_run, client, type_tenants, num_tenants)— used afterget_monitoring_aggregated_per_phase_multitenant()has already aggregated away thebenchmark_rundimension via its groupby, so omittingbenchmark_runfrom the key is intentional.Loading key join on
(code, configuration, experiment_run).
collectors.get_non_constant(df)
Standalone function. Drops all columns whose values are identical across every row — useful after get_connections() to surface the parameters that actually vary across experiment runs.
Benchmark-Specific Subclasses
Each subclass extends base by providing the correct evaluator. Most data retrieval is inherited; subclasses add benchmark-specific parsing.
collectors.benchbase
For Benchbase experiments.
Evaluator provides access to throughput and latency time-series parsed directly from Benchbase log files:
evaluate = collect.get_evaluator(code)
evaluate.get_benchmark_logs_timeseries_df_aggregated(metric, configuration, client, experiment_run)
evaluate.get_benchmark_logs_timeseries_df_single(metric, configuration, client, experiment_run)
metric is typically "throughput" or "latency".
The collector adds two time-series methods that span all experiment codes:
get_benchmark_timeseries_per_phase(metric='throughput')
Wide-format DataFrame: index is second, each column represents one benchmark job identified by (code, configuration, experiment_run, client, benchmark_run), labelled {code}-{configuration}-{experiment_run}-{client}-{benchmark_run}. Jobs with different time ranges produce NaN for missing seconds.
get_benchmark_timeseries_all(metric='throughput')
Long-format DataFrame with columns second, code, configuration, experiment_run, client, benchmark_run, metric, value, plus connection metadata columns (e.g. type_tenants, num_tenants, vol_tenants). One row per second per job.
collectors.tpcc
For HammerDB TPC-C experiments.
Evaluator parses TPM (Transactions Per Minute) and NOPM (New Orders Per Minute) from HammerDB log output.
collectors.ycsb
For YCSB experiments.
Loading and benchmarking are both instrumented. The evaluator additionally exposes:
evaluate = collect.get_evaluator(code)

# Loading — summary
evaluate.get_loading_per_connection()
evaluate.get_loading_per_pod()

# Benchmarking — time series (per configuration, client, experiment_run)
evaluate.get_benchmark_logs_timeseries_df_aggregated(metric, configuration, client, experiment_run)
evaluate.get_benchmark_logs_timeseries_df_single(metric, configuration, client, experiment_run)

# Loading — time series (per configuration, experiment_run; no client dimension)
evaluate.get_loading_logs_timeseries_df_aggregated(metric, configuration, experiment_run)
evaluate.get_loading_logs_timeseries_df_single(metric, configuration, experiment_run)
metric defaults to "current_ops_per_sec" for all time-series methods. Both loading variants reuse the same log parser as the benchmarking variants; the only difference is that the pod list is drawn from get_df_loading() instead of get_df_benchmarking(), and there is no client filter.
The collector adds four time-series methods that span all experiment codes:
get_benchmark_timeseries_per_phase(metric='current_ops_per_sec')
Wide-format DataFrame: index is second, each column represents one benchmark job identified by (code, configuration, experiment_run, client, benchmark_run), labelled {code}-{configuration}-{experiment_run}-{client}-{benchmark_run}.
get_benchmark_timeseries_all(metric='current_ops_per_sec')
Long-format DataFrame with columns second, code, configuration, experiment_run, client, benchmark_run, metric, value, plus connection metadata columns. One row per second per job.
get_loading_timeseries_per_phase(metric='current_ops_per_sec')
Wide-format DataFrame for the loading phase: index is second, each column represents one (code, configuration, experiment_run) loading job, labelled {code}-{configuration}-{experiment_run}. No client dimension.
get_loading_timeseries_all(metric='current_ops_per_sec')
Long-format DataFrame for the loading phase with columns second, code, configuration, experiment_run, metric, value, plus connection metadata columns (excluding client). One row per second per loading job.
collectors.dbmsbenchmarker
For DBMSBenchmarker experiments. Adds query-level analytics:
get_query_latencies(query_titles=False)
Per-query latency statistics (aggregated with geometric mean across parallel pods) for all codes.
get_total_errors(query_titles=False)
Per-query failed-execution counts for all codes.
get_total_warnings(query_titles=False)
Per-query result-mismatch counts for all codes.
Pass query_titles=True to replace the numeric query index with the human-readable title from the query configuration.
collectors.mixed
For experiments that ran more than one benchmark tool in a single experiment (e.g. Benchbase followed by YCSB, or two different tools in the same client round).
How it works
When an experiment finishes, store_workflow_results() writes a benchmark_sequence key into queries.config:
# Example queries.config entry
'benchmark_sequence': [
    {'index': 1, 'type': 'benchbase'},
    {'index': 2, 'type': 'ycsb'},
]
collectors.mixed reads this key and dispatches to the correct typed sub-collector for each benchmark-run index, so each tool’s log files are parsed by the right evaluator.
The constraint is that all configurations in an experiment must share the same benchmark sequence (which is enforced by the experiment framework — every configuration receives a deep copy of the same experiment_dict_template).
Constructor
collect = collectors.mixed(path, codes)
Same signature as the typed collectors. Reads benchmark_sequence from queries.config of the first code.
Methods
get_typed_collector(benchmark_run: int)
Returns a fully functional typed sub-collector (e.g. collectors.benchbase) scoped to the given benchmark-run index. All standard methods (get_performance_aggregated_per_phase, get_monitoring_aggregated_per_phase, etc.) are available on the returned object.
get_performance_per_benchmark()
Calls get_performance_aggregated_per_phase() on each typed sub-collector and returns a dict keyed by benchmark type name:
results = collect.get_performance_per_benchmark()
# {'benchbase': df_benchbase, 'ycsb': df_ycsb}
When two entries share the same tool type (parallel runs of the same tool), their DataFrames are concatenated under the shared key, with benchmark_run as a distinguishing column.
Supported type names
|
Mapped collector |
|---|---|
|
|
|
|
|
|
|
|
Minimal Example
from bexhoma import collectors

path  = "/results"
codes = ["1776751747", "1776754749"]

collect = collectors.benchbase(path, codes)

# What varied across these two experiments?
df_conn = collect.get_connections()
collectors.get_non_constant(df_conn)

# Benchmarking throughput, one row per job (benchmark_run kept separate)
collect.get_performance_aggregated_per_job()

# Benchmarking throughput, one row per phase (all benchmark_runs merged)
collect.get_performance_aggregated_per_phase()

# Hardware monitoring summary, one row per job
collect.get_monitoring_aggregated_per_job("stream")

# Hardware monitoring summary, one row per phase
collect.get_monitoring_aggregated_per_phase("stream")

# CPU time-series across all codes (long format)
collect.get_monitoring_timeseries_all(metric="total_cpu_memory")

# Enrich a custom DataFrame with experiment metadata
df = collect.get_monitoring_aggregated_per_phase("stream")
collect.add_metadata(df)
References
[1] Benchmarking Multi-Tenant Architectures in PostgreSQL
Erdelt, P.K., and Rabl T. (2026). In: Proceedings 29th International Conference on Extending Database Technology, EDBT 2026. OpenProceedings.org.