Benchmark: HammerDB’s TPC-C
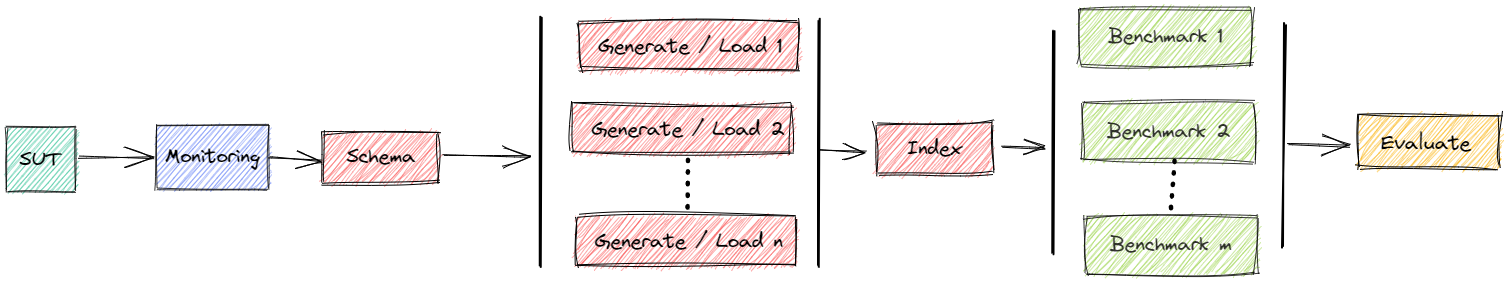
HammerDB’s TPC-C implementation does not allow scaling data generation and ingestion, but scaling the benchmarking driver. It uses very little resources, but stresses the DBMS a lot. Scale-out can simulate distributed clients [4].
About the benchmark [1]:
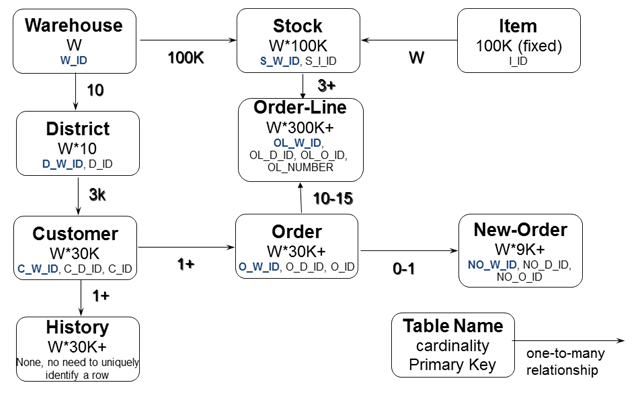
The TPC-C specification on which TPROC-C is based implements a computer system to fulfil orders from customers to supply products from a company. The company sells 100,000 items and keeps its stock in warehouses. Each warehouse has 10 sales districts and each district serves 3000 customers. The customers call the company whose operators take the order, each order containing a number of items. Orders are usually satisfied from the local warehouse however a small number of items are not in stock at a particular point in time and are supplied by an alternative warehouse. It is important to note that the size of the company is not fixed and can add Warehouses and sales districts as the company grows. For this reason your test schema can be as small or large as you wish with a larger schema requiring a more powerful computer system to process the increased level of transactions. The TPROC-C schema is shown below, in particular note how the number of rows in all of the tables apart from the ITEM table which is fixed is dependent upon the number of warehouses you choose to create your schema.
About the metrics [2]:
HammerDB workloads produce 2 statistics to compare systems called TPM and NOPM respectively. NOPM value is based on a metric captured from within the test schema itself. As such NOPM (New Orders per minute) as a performance metric independent of any particular database implementation is the recommended primary metric to use.
The results are not official benchmark results. Exact performance depends on a number of parameters. You may get different results. These examples are solely to illustrate how to use bexhoma and show the result evaluation.
References
HammerDB Docs: https://www.hammerdb.com/docs/ch03s05.html
HammerDB Docs: https://www.hammerdb.com/docs/ch03s04.html
HammerDB Docs: https://www.hammerdb.com/docs/ch03.html
A Cloud-Native Adoption of Classical DBMS Performance Benchmarks and Tools: https://doi.org/10.1007/978-3-031-68031-1_9
Perform Benchmark
You will have to change the node selectors there (to names of nodes, that exist in your cluster - or to leave out the corresponding parameters):
BEXHOMA_NODE_SUT="cl-worker11"
BEXHOMA_NODE_LOAD="cl-worker19"
BEXHOMA_NODE_BENCHMARK="cl-worker19"
LOG_DIR="./logs_tests"
BEXHOMA_MS=1
BEXHOMA_STORAGE_CLASS="shared"

mkdir -p $LOG_DIR
For performing the experiment we can run the hammerdb file.
Example:
bexhoma hammerdb \
  -dbms PostgreSQL \
  -sf 16 \
  -xsd 5 \
  -nlt 16 \
  -nbp 1,2 \
  -nbt 16 \
  -ms $BEXHOMA_MS \
  -tr \
  -lr 64Gi \
  -rr 64Gi \
  -rss 50Gi \
  -rnn $BEXHOMA_NODE_SUT -rnl $BEXHOMA_NODE_LOAD -rnb $BEXHOMA_NODE_BENCHMARK \
  run &>$LOG_DIR/docs_hammerdb_postgresql_scale.log
This
starts a clean instance of PostgreSQL (
-dbms)data directory inside a Docker container
starts 1 loader pod (per DBMS) that
creates TPC-C schema in the database
imports data for 16 (
-sf) warehouses into the DBMSusing 16 (
-nlt) threads
runs streams of TPC-C queries (per DBMS)
running for 5 (
-xsd) minuteseach stream (pod) having 16 threads to simulate 16 users (
-nbt)-nbp: first stream 1 pod, second stream 2 pods (8 threads each)
with a maximum of 1 DBMS per time (
-ms)tests if results match workflow (
-tr)shows a summary
Status
You can watch the status while benchmark is running via bexhoma status
Dashboard: Running
Cluster Prometheus: Running
Message Queue: Running
Data directory: Running
Result directory: Running
+---------------------+--------------+--------------+---------------+-------------+
| 1726578005          | sut          |   loaded [s] | use case      | loading     |
+=====================+==============+==============+===============+=============+
| PostgreSQL-BHT-16-1 | (1. Running) |            1 | hammerdb_tpcc | (1 Running) |
+---------------------+--------------+--------------+---------------+-------------+
The code 1726578005 is the unique identifier of the experiment.
You can find the number also in the output of hammerdb.py.
Cleanup
The script is supposed to clean up and remove everything from the cluster that is related to the experiment after finishing.
If something goes wrong, you can also clean up manually with bexperiment stop (removes everything) or bexperiment stop -e 1726578005 (removes everything that is related to experiment 1726578005).
Evaluate Results
At the end of a benchmark you will see a summary like
docs_hammerdb_postgresql_scale.log
## Show Summary

### Workload
HammerDB Workload SF=16 (warehouses for TPC-C)
* Type: tpcc
* Duration: 1358s
* Code: 1783808193
* HammerDB runs the benchmark.
* This experiment compares run time and resource consumption of TPC-C queries in different DBMS.
  * TPC-C data is generated and loaded using several threads.
  * Scaling factor (i.e., number of warehouses) is 16. Benchmarking runs for 5 minutes.
  * Experiment uses bexhoma version 0.10.4.
  * Experiment is limited to DBMS ['PostgreSQL'].
  * Import is handled by 1 processes (pods).
  * Loading is fixed to cl-worker19.
  * Benchmarking is fixed to cl-worker19.
  * SUT is fixed to cl-worker36.
  * Database uses ephemeral storage of size 50Gi.
  * Loading is tested with [16] threads, split into [1] pods.
  * Benchmarking is tested with [16] threads, split into [1, 2] pods.
  * Benchmarking is run as [1] times the number of benchmarking pods.
  * Experiment is run once.

### Connections
* PostgreSQL-1-1-1-1 uses docker image postgres:18.3
  * RAM:2164173213696
  * CPU:INTEL(R) XEON(R) PLATINUM 8570
  * Cores:224
  * host:6.8.0-111-generic
  * node:cl-worker36
  * disk:1079942
  * cpu_list:0-223
  * args:['-c', 'max_connections=640', '-c', 'max_worker_processes=16', '-c', 'max_parallel_workers=16', '-c', 'max_parallel_workers_per_gather=8', '-c', 'max_parallel_maintenance_workers=4', '-c', 'shared_buffers=16GB', '-c', 'effective_cache_size=40GB', '-c', 'work_mem=512MB', '-c', 'maintenance_work_mem=2GB', '-c', 'autovacuum=off', '-c', 'wal_level=minimal', '-c', 'max_wal_senders=0', '-c', 'max_wal_size=32GB', '-c', 'checkpoint_timeout=1h', '-c', 'checkpoint_completion_target=1.0', '-c', 'lock_timeout=30s', '-c', 'idle_in_transaction_session_timeout=30000']
  * requests_cpu:4
  * requests_memory:64Gi
  * limits_memory:64Gi
  * eval_parameters
    * code:1783808193
* PostgreSQL-1-1-2-1 uses docker image postgres:18.3
  * RAM:2164173213696
  * CPU:INTEL(R) XEON(R) PLATINUM 8570
  * Cores:224
  * host:6.8.0-111-generic
  * node:cl-worker36
  * disk:1102359
  * cpu_list:0-223
  * args:['-c', 'max_connections=640', '-c', 'max_worker_processes=16', '-c', 'max_parallel_workers=16', '-c', 'max_parallel_workers_per_gather=8', '-c', 'max_parallel_maintenance_workers=4', '-c', 'shared_buffers=16GB', '-c', 'effective_cache_size=40GB', '-c', 'work_mem=512MB', '-c', 'maintenance_work_mem=2GB', '-c', 'autovacuum=off', '-c', 'wal_level=minimal', '-c', 'max_wal_senders=0', '-c', 'max_wal_size=32GB', '-c', 'checkpoint_timeout=1h', '-c', 'checkpoint_completion_target=1.0', '-c', 'lock_timeout=30s', '-c', 'idle_in_transaction_session_timeout=30000']
  * requests_cpu:4
  * requests_memory:64Gi
  * limits_memory:64Gi
  * eval_parameters
    * code:1783808193

### SUT Container Restarts
* bexhoma-sut-postgresql-1-1783808193-88bc9dc78-kcc9v: 0 0

### Workflow

#### Actual

* DBMS PostgreSQL-1 - Experiment 1 Client 1: hammerdb (1 pods)
* DBMS PostgreSQL-1 - Experiment 1 Client 2: hammerdb (2 pods)

#### Planned

* DBMS PostgreSQL-1 - Experiment 1 Client 1: hammerdb (1 pods)
* DBMS PostgreSQL-1 - Experiment 1 Client 2: hammerdb (2 pods)

### Loading

#### Per Run

|                |   experiment_run |    SF |   time_load |   time_preload |   time_generate |   time_ingest |   time_postload |   loading_pods |   terminals | tenant_id   | type_tenants   |   num_tenants | vol_tenants   |   Throughput [SF/h] |
|:---------------|-----------------:|------:|------------:|---------------:|----------------:|--------------:|----------------:|---------------:|------------:|:------------|:---------------|--------------:|:--------------|--------------------:|
| PostgreSQL-1-1 |                1 | 16.00 |      167.00 |           1.00 |            0.00 |         59.00 |          107.00 |              1 |          16 |             | None           |             0 | False         |              344.91 |

### Execution

#### Per Connection

| DBMS                 | phase            | job                |   experiment_run |   vusers |   client |   benchmark_run |   child |   NOPM |    TPM |   efficiency |   duration |   errors |
|:---------------------|:-----------------|:-------------------|-----------------:|---------:|---------:|----------------:|--------:|-------:|-------:|-------------:|-----------:|---------:|
| PostgreSQL-1-1-1-1-1 | PostgreSQL-1-1-1 | PostgreSQL-1-1-1-1 |                1 |       16 |        1 |               1 |       1 | 308820 | 710626 |         0.00 |          5 |        0 |
| PostgreSQL-1-1-2-1-2 | PostgreSQL-1-1-2 | PostgreSQL-1-1-2-1 |                1 |        8 |        2 |               1 |       2 |  48101 | 110660 |         0.00 |          5 |        0 |
| PostgreSQL-1-1-2-1-1 | PostgreSQL-1-1-2 | PostgreSQL-1-1-2-1 |                1 |        8 |        2 |               1 |       1 |  48068 | 110586 |         0.00 |          5 |        0 |

#### Per Phase

| DBMS             | phase            |   experiment_run |   vusers |   client |   benchmark_run |   pod_count |   efficiency |      NOPM |       TPM |   duration |   errors |
|:-----------------|:-----------------|-----------------:|---------:|---------:|----------------:|------------:|-------------:|----------:|----------:|-----------:|---------:|
| PostgreSQL-1-1-1 | PostgreSQL-1-1-1 |                1 |       16 |        1 |               1 |           1 |         0.00 | 308820.00 | 710626.00 |          5 |        0 |
| PostgreSQL-1-1-2 | PostgreSQL-1-1-2 |                1 |       16 |        2 |               1 |           2 |         0.00 |  48084.50 | 110623.00 |          5 |        0 |

### Tests
* TEST passed: No SUT container restarts
* TEST passed: NOPM contains no 0 or NaN
* TEST passed: Workflow as planned
We can see that scaled-out drivers (2 pods with 8 threads each) have similar results as a monolithic driver (1 pod with 16 threads) - but are a bit weaker.
To see the summary again you can simply call bexhoma summary -e 1708411664 with the experiment code.
Detailed Evaluation
Results are transformed into pandas DataFrames and can be inspected in detail. See for example
You can connect to an evaluation server in the cluster by bexhoma dashboard.
This forwards ports, so you have
a Jupyter notebook server at http://localhost:8888
You can connect to an evaluation server locally by bexhoma jupyter.
This forwards ports, so you have
a Jupyter notebook server at http://localhost:8888
Adjust Parameters
The script supports
exact repetitions for statistical confidence
variations to scan a large parameters space
combine results for easy evaluation
There are various ways to change parameters.
Manifests
The YAML manifests for the components can be found in https://github.com/Beuth-Erdelt/Benchmark-Experiment-Host-Manager/tree/master/k8s
Dockerfiles
The Dockerfiles for the components can be found in https://github.com/Beuth-Erdelt/Benchmark-Experiment-Host-Manager/tree/master/images/hammerdb
Command line
You maybe want to adjust some of the parameters that are set in the file: python hammerdb.py -h
usage: hammerdb.py [-h] [-aws] [-dbms [{PostgreSQL,MySQL,MariaDB,Citus} ...]] [-db] [-sl] [-cx CONTEXT] [-e EXPERIMENT] [-m] [-mc] [-ms MAX_SUT] [-xdt] [-xqr NUM_RUN] [-nc NUM_CONFIG]
                   [-ne NUM_QUERY_EXECUTORS] [-nw NUM_WORKER] [-nwr NUM_WORKER_REPLICAS] [-nws NUM_WORKER_SHARDS] [-nlp NUM_LOADING_PODS] [-nlt NUM_LOADING_THREADS] [-nbp NUM_BENCHMARKING_PODS]
                   [-nbt NUM_BENCHMARKING_THREADS] [-xrt NUM_RAMPUP_TIME] [-sf SCALING_FACTOR] [-xsd SCALING_DURATION] [-xlat] [-xkey] [-t TIMEOUT] [-rr REQUEST_RAM] [-rc REQUEST_CPU]
                   [-rct REQUEST_CPU_TYPE] [-rg REQUEST_GPU] [-rgt REQUEST_GPU_TYPE] [-rst {None,,local-hdd,shared}] [-rss REQUEST_STORAGE_SIZE] [-rnn REQUEST_NODE_NAME] [-rnl REQUEST_NODE_LOADING]
                   [-rnb REQUEST_NODE_BENCHMARKING] [-tr]
                   {run,start,load,summary}

Perform TPC-C inspired benchmarks in a Kubernetes cluster. Optionally monitoring is actived. User can also choose some parameters like number of warehouses and request some resources.

positional arguments:
  {run,start,load,summary}
                        start sut, also load data or also run the TPC-C queries

options:
  -h, --help            show this help message and exit
  -aws, --aws           fix components to node groups at AWS
  -dbms [{PostgreSQL,MySQL,MariaDB,Citus} ...], --dbms [{PostgreSQL,MySQL,MariaDB,Citus} ...]
                        DBMS to load the data
  -db, --debug          dump debug informations
  -sl, --skip-loading   do not ingest, start benchmarking immediately
  -cx CONTEXT, --context CONTEXT
                        context of Kubernetes (for a multi cluster environment), default is current context
  -e EXPERIMENT, --experiment EXPERIMENT
                        sets experiment code for continuing started experiment
  -m, --monitoring      activates monitoring for sut
  -mc, --monitoring-cluster
                        activates monitoring for all nodes of cluster
  -ms MAX_SUT, --max-sut MAX_SUT
                        maximum number of parallel DBMS configurations, default is no limit
  -xdt, --datatransfer   activates datatransfer
  -xqr NUM_RUN, --num-run NUM_RUN
                        number of runs per query
  -nc NUM_CONFIG, --num-config NUM_CONFIG
                        number of runs per configuration
  -ne NUM_QUERY_EXECUTORS, --num-query-executors NUM_QUERY_EXECUTORS
                        comma separated list of number of parallel clients
  -nw NUM_WORKER, --num-worker NUM_WORKER
                        number of workers (for distributed dbms)
  -nwr NUM_WORKER_REPLICAS, --num-worker-replicas NUM_WORKER_REPLICAS
                        number of workers replications (for distributed dbms)
  -nws NUM_WORKER_SHARDS, --num-worker-shards NUM_WORKER_SHARDS
                        number of worker shards (for distributed dbms)
  -nlp NUM_LOADING_PODS, --num-loading-pods NUM_LOADING_PODS
                        total number of loaders per configuration
  -nlt NUM_LOADING_THREADS, --num-loading-threads NUM_LOADING_THREADS
                        total number of threads per loading process
  -nbp NUM_BENCHMARKING_PODS, --num-benchmarking-pods NUM_BENCHMARKING_PODS
                        comma separated list of number of benchmarkers per configuration
  -nbt NUM_BENCHMARKING_THREADS, --num-benchmarking-threads NUM_BENCHMARKING_THREADS
                        total number of threads per benchmarking process
  -xrt NUM_RAMPUP_TIME, --num-rampup-time NUM_RAMPUP_TIME
                        Rampup time in minutes
  -sf SCALING_FACTOR, --scaling-factor SCALING_FACTOR
                        scaling factor (SF) = number of warehouses
  -xsd SCALING_DURATION, --scaling-duration SCALING_DURATION
                        scaling factor = duration in minutes
  -xlat, --extra-latency
                        also log latencies
  -xkey, --extra-keying
                        activate keying and waiting time
  -t TIMEOUT, --timeout TIMEOUT
                        timeout for a run of a query
  -rr REQUEST_RAM, --request-ram REQUEST_RAM
                        request ram
  -rc REQUEST_CPU, --request-cpu REQUEST_CPU
                        request cpus
  -rct REQUEST_CPU_TYPE, --request-cpu-type REQUEST_CPU_TYPE
                        request node having node label cpu=
  -rg REQUEST_GPU, --request-gpu REQUEST_GPU
                        request number of gpus
  -rgt REQUEST_GPU_TYPE, --request-gpu-type REQUEST_GPU_TYPE
                        request node having node label gpu=
  -rst {None,,local-hdd,shared}, --request-storage-type {None,,local-hdd,shared}
                        request persistent storage of certain type
  -rss REQUEST_STORAGE_SIZE, --request-storage-size REQUEST_STORAGE_SIZE
                        request persistent storage of certain size
  -rnn REQUEST_NODE_NAME, --request-node-name REQUEST_NODE_NAME
                        request a specific node
  -rnl REQUEST_NODE_LOADING, --request-node-loading REQUEST_NODE_LOADING
                        request a specific node
  -rnb REQUEST_NODE_BENCHMARKING, --request-node-benchmarking REQUEST_NODE_BENCHMARKING
                        request a specific node
  -tr, --test-result    test if result fulfills some basic requirements
Monitoring
Monitoring can be activated for DBMS only (-m) or for all components (-mc).
We in the following also activate measurement of latencies with -xlat.
Example:
bexhoma hammerdb \
  -dbms PostgreSQL \
  -sf 16 \
  -xsd 5 \
  -nlt 16 \
  -nbp 1,2 \
  -nbt 16 \
  -xlat \
  -m \
  -mc \
  -ms $BEXHOMA_MS \
  -tr \
  -lr 64Gi \
  -rr 64Gi \
  -rss 50Gi \
  -rnn $BEXHOMA_NODE_SUT -rnl $BEXHOMA_NODE_LOAD -rnb $BEXHOMA_NODE_BENCHMARK \
  run &>$LOG_DIR/docs_hammerdb_postgresql_monitoring.log
If monitoring is activated, the summary also contains a section like
docs_hammerdb_postgresql_monitoring.log
## Show Summary

### Workload
HammerDB Workload SF=16 (warehouses for TPC-C)
* Type: tpcc
* Duration: 1427s
* Code: 1783809557
* HammerDB runs the benchmark.
* This experiment compares run time and resource consumption of TPC-C queries in different DBMS.
  * TPC-C data is generated and loaded using several threads.
  * Scaling factor (i.e., number of warehouses) is 16. Benchmarking runs for 5 minutes. Benchmarking also logs latencies.
  * Experiment uses bexhoma version 0.10.4.
  * System metrics are monitored by a cluster-wide installation.
  * Experiment is limited to DBMS ['PostgreSQL'].
  * Import is handled by 1 processes (pods).
  * Loading is fixed to cl-worker19.
  * Benchmarking is fixed to cl-worker19.
  * SUT is fixed to cl-worker36.
  * Database uses ephemeral storage of size 50Gi.
  * Loading is tested with [16] threads, split into [1] pods.
  * Benchmarking is tested with [16] threads, split into [1, 2] pods.
  * Benchmarking is run as [1] times the number of benchmarking pods.
  * Experiment is run once.

### Connections
* PostgreSQL-1-1-1-1 uses docker image postgres:18.3
  * RAM:2164173213696
  * CPU:INTEL(R) XEON(R) PLATINUM 8570
  * Cores:224
  * host:6.8.0-111-generic
  * node:cl-worker36
  * disk:1082047
  * cpu_list:0-223
  * args:['-c', 'max_connections=640', '-c', 'max_worker_processes=16', '-c', 'max_parallel_workers=16', '-c', 'max_parallel_workers_per_gather=8', '-c', 'max_parallel_maintenance_workers=4', '-c', 'shared_buffers=16GB', '-c', 'effective_cache_size=40GB', '-c', 'work_mem=512MB', '-c', 'maintenance_work_mem=2GB', '-c', 'autovacuum=off', '-c', 'wal_level=minimal', '-c', 'max_wal_senders=0', '-c', 'max_wal_size=32GB', '-c', 'checkpoint_timeout=1h', '-c', 'checkpoint_completion_target=1.0', '-c', 'lock_timeout=30s', '-c', 'idle_in_transaction_session_timeout=30000']
  * requests_cpu:4
  * requests_memory:64Gi
  * limits_memory:64Gi
  * eval_parameters
    * code:1783809557
* PostgreSQL-1-1-2-1 uses docker image postgres:18.3
  * RAM:2164173213696
  * CPU:INTEL(R) XEON(R) PLATINUM 8570
  * Cores:224
  * host:6.8.0-111-generic
  * node:cl-worker36
  * disk:1112482
  * cpu_list:0-223
  * args:['-c', 'max_connections=640', '-c', 'max_worker_processes=16', '-c', 'max_parallel_workers=16', '-c', 'max_parallel_workers_per_gather=8', '-c', 'max_parallel_maintenance_workers=4', '-c', 'shared_buffers=16GB', '-c', 'effective_cache_size=40GB', '-c', 'work_mem=512MB', '-c', 'maintenance_work_mem=2GB', '-c', 'autovacuum=off', '-c', 'wal_level=minimal', '-c', 'max_wal_senders=0', '-c', 'max_wal_size=32GB', '-c', 'checkpoint_timeout=1h', '-c', 'checkpoint_completion_target=1.0', '-c', 'lock_timeout=30s', '-c', 'idle_in_transaction_session_timeout=30000']
  * requests_cpu:4
  * requests_memory:64Gi
  * limits_memory:64Gi
  * eval_parameters
    * code:1783809557

### SUT Container Restarts
* bexhoma-sut-postgresql-1-1783809557-7c448fbf87-h2qpd: 0 0

### Workflow

#### Actual

* DBMS PostgreSQL-1 - Experiment 1 Client 1: hammerdb (1 pods)
* DBMS PostgreSQL-1 - Experiment 1 Client 2: hammerdb (2 pods)

#### Planned

* DBMS PostgreSQL-1 - Experiment 1 Client 1: hammerdb (1 pods)
* DBMS PostgreSQL-1 - Experiment 1 Client 2: hammerdb (2 pods)

### Loading

#### Per Run

|                |   experiment_run |    SF |   time_load |   time_preload |   time_generate |   time_ingest |   time_postload |   loading_pods |   terminals | tenant_id   | type_tenants   |   num_tenants | vol_tenants   |   Throughput [SF/h] |
|:---------------|-----------------:|------:|------------:|---------------:|----------------:|--------------:|----------------:|---------------:|------------:|:------------|:---------------|--------------:|:--------------|--------------------:|
| PostgreSQL-1-1 |                1 | 16.00 |      123.00 |           1.00 |            0.00 |         49.00 |           73.00 |              1 |          16 |             | None           |             0 | False         |              468.29 |

### Execution

#### Per Connection

| DBMS                 | phase            | job                |   experiment_run |   vusers |   client |   benchmark_run |   child |   NOPM |    TPM |   efficiency |   duration |   errors |   P95 [ms] |   P99 [ms] |
|:---------------------|:-----------------|:-------------------|-----------------:|---------:|---------:|----------------:|--------:|-------:|-------:|-------------:|-----------:|---------:|-----------:|-----------:|
| PostgreSQL-1-1-1-1-1 | PostgreSQL-1-1-1 | PostgreSQL-1-1-1-1 |                1 |       16 |        1 |               1 |       1 | 292235 | 671063 |         0.00 |          5 |        0 |       2.00 |       3.16 |
| PostgreSQL-1-1-2-1-1 | PostgreSQL-1-1-2 | PostgreSQL-1-1-2-1 |                1 |        8 |        2 |               1 |       1 |  56056 | 128945 |         0.00 |          5 |        0 |       1.64 |       3.23 |
| PostgreSQL-1-1-2-1-2 | PostgreSQL-1-1-2 | PostgreSQL-1-1-2-1 |                1 |        8 |        2 |               1 |       2 |  56081 | 128925 |         0.00 |          5 |        0 |       1.62 |       3.24 |

#### Per Phase

| DBMS             | phase            |   experiment_run |   vusers |   client |   benchmark_run |   pod_count |   P95 [ms] |   P99 [ms] |   efficiency |      NOPM |       TPM |   duration |   errors |
|:-----------------|:-----------------|-----------------:|---------:|---------:|----------------:|------------:|-----------:|-----------:|-------------:|----------:|----------:|-----------:|---------:|
| PostgreSQL-1-1-1 | PostgreSQL-1-1-1 |                1 |       16 |        1 |               1 |           1 |       2.00 |       3.16 |         0.00 | 292235.00 | 671063.00 |          5 |        0 |
| PostgreSQL-1-1-2 | PostgreSQL-1-1-2 |                1 |       16 |        2 |               1 |           2 |       1.64 |       3.24 |         0.00 |  56068.50 | 128935.00 |          5 |        0 |

### Monitoring

### Loading phase: SUT deployment

| DBMS               |   CPU [CPUs] |   Max CPU |   Max RAM [Gb] |   Max RAM Cached [Gb] |
|:-------------------|-------------:|----------:|---------------:|----------------------:|
| PostgreSQL-1-1-1-1 |        42.25 |      0.91 |           1.67 |                  2.37 |
| PostgreSQL-1-1-2-1 |        42.25 |      0.91 |           1.67 |                  2.37 |

### Loading phase: component loader

| DBMS               |   CPU [CPUs] |   Max CPU |   Max RAM [Gb] |   Max RAM Cached [Gb] |
|:-------------------|-------------:|----------:|---------------:|----------------------:|
| PostgreSQL-1-1-1-1 |       401.69 |     12.32 |           0.16 |                  0.16 |
| PostgreSQL-1-1-2-1 |       401.69 |     12.32 |           0.16 |                  0.16 |

### Execution phase: SUT deployment

| DBMS               |   CPU [CPUs] |   Max CPU |   Max RAM [Gb] |   Max RAM Cached [Gb] |
|:-------------------|-------------:|----------:|---------------:|----------------------:|
| PostgreSQL-1-1-1-1 |      2144.33 |      6.01 |           5.79 |                  9.99 |
| PostgreSQL-1-1-2-1 |      5912.89 |     14.80 |           6.70 |                 11.60 |

### Execution phase: component benchmarker

| DBMS               |   CPU [CPUs] |   Max CPU |   Max RAM [Gb] |   Max RAM Cached [Gb] |
|:-------------------|-------------:|----------:|---------------:|----------------------:|
| PostgreSQL-1-1-1-1 |      1077.64 |      2.86 |           1.90 |                  1.90 |
| PostgreSQL-1-1-2-1 |      1077.64 |      3.18 |           1.90 |                  1.90 |

### Tests
* TEST passed: No SUT container restarts
* TEST passed: Loading phase: SUT deployment contains no 0 or NaN in CPU [CPUs]
* TEST passed: Loading phase: component loader contains no 0 or NaN in CPU [CPUs]
* TEST passed: Execution phase: SUT deployment contains no 0 or NaN in CPU [CPUs]
* TEST passed: Execution phase: component benchmarker contains no 0 or NaN in CPU [CPUs]
* TEST passed: NOPM contains no 0 or NaN
* TEST passed: Workflow as planned
This gives a survey about CPU (in CPU seconds) and RAM usage (in Gb) during loading and execution of the benchmark.
In this example, metrics are very instable. Metrics are fetched every 30 seconds. This is too coarse for such a quick example.
Use Persistent Storage
The default behaviour of bexhoma is that the database is stored inside the ephemeral storage of the Docker container. If your cluster allows dynamic provisioning of volumes, you might request a persistent storage of a certain type (storageClass) and size.
Example:
bexhoma hammerdb \
  -dbms PostgreSQL \
  -sf 16 \
  -xsd 5 \
  -nc 2 \
  -ne 1 \
  -nlt 8 \
  -nbp 1 \
  -nbt 16 \
  -xlat \
  -ms $BEXHOMA_MS \
  -tr \
  -lr 64Gi \
  -rr 64Gi \
  -rsr \
  -rss 50Gi \
  -rst $BEXHOMA_STORAGE_CLASS \
  -rnn $BEXHOMA_NODE_SUT -rnl $BEXHOMA_NODE_LOAD -rnb $BEXHOMA_NODE_BENCHMARK \
  run &>$LOG_DIR/docs_hammerdb_postgresql_storage.log
The following status shows we have two volumes of type shared.
Every experiment running HammerDB’s TPC-C of SF=16 (warehouses) will take the databases from these volumes and skip loading.
In this example -nc is set to two, that is the complete experiment is repeated twice for statistical confidence.
The first instance of PostgreSQL mounts the volume and generates the data.
All other instances just use the database without generating and loading data.
+------------------------------------------+-----------------+---------------+--------------+-------------------+------------+----------------------+-----------+----------+--------+--------+
| Volumes                                  | configuration   | experiment    | loaded [s]   |   timeLoading [s] | dbms       | storage_class_name   | storage   | status   | size   | used   |
+------------------------------------------+-----------------+---------------+--------------+-------------------+------------+----------------------+-----------+----------+--------+--------+
| bexhoma-storage-postgresql-hammerdb-16   | postgresql      | hammerdb-16   | True         |               101 | PostgreSQL | shared               | 30Gi      | Bound    | 30G    | 4.8G   |
+------------------------------------------+-----------------+---------------+--------------+-------------------+------------+----------------------+-----------+----------+--------+--------+
| bexhoma-storage-postgresql-hammerdb-128  | postgresql      | hammerdb-128  | True         |               369 | PostgreSQL | shared               | 50Gi      | Bound    | 50G    | 43G    |
+------------------------------------------+-----------------+---------------+--------------+-------------------+------------+----------------------+-----------+----------+--------+--------+
The result looks something like
docs_hammerdb_postgresql_storage.log
## Show Summary

### Workload
HammerDB Workload SF=16 (warehouses for TPC-C)
* Type: tpcc
* Duration: 1811s
* Code: 1783811010
* HammerDB runs the benchmark.
* This experiment compares run time and resource consumption of TPC-C queries in different DBMS.
  * TPC-C data is generated and loaded using several threads.
  * Scaling factor (i.e., number of warehouses) is 16. Benchmarking runs for 5 minutes. Benchmarking also logs latencies.
  * Experiment uses bexhoma version 0.10.4.
  * Experiment is limited to DBMS ['PostgreSQL'].
  * Import is handled by 1 processes (pods).
  * Loading is fixed to cl-worker19.
  * Benchmarking is fixed to cl-worker19.
  * SUT is fixed to cl-worker36.
  * Database is persisted to disk of type shared and size 50Gi. Persistent storage is removed at experiment start.
  * Loading is tested with [8] threads, split into [1] pods.
  * Benchmarking is tested with [16] threads, split into [1] pods.
  * Benchmarking is run as [1] times the number of benchmarking pods.
  * Experiment is run 2 times.

### Connections
* PostgreSQL-1-1-1-1 uses docker image postgres:18.3
  * RAM:2164173213696
  * CPU:INTEL(R) XEON(R) PLATINUM 8570
  * Cores:224
  * host:6.8.0-111-generic
  * node:cl-worker36
  * disk:1062793
  * volume_size:50G
  * volume_used:3.3G
  * cpu_list:0-223
  * args:['-c', 'max_connections=640', '-c', 'max_worker_processes=16', '-c', 'max_parallel_workers=16', '-c', 'max_parallel_workers_per_gather=8', '-c', 'max_parallel_maintenance_workers=4', '-c', 'shared_buffers=16GB', '-c', 'effective_cache_size=40GB', '-c', 'work_mem=512MB', '-c', 'maintenance_work_mem=2GB', '-c', 'autovacuum=off', '-c', 'wal_level=minimal', '-c', 'max_wal_senders=0', '-c', 'max_wal_size=32GB', '-c', 'checkpoint_timeout=1h', '-c', 'checkpoint_completion_target=1.0', '-c', 'lock_timeout=30s', '-c', 'idle_in_transaction_session_timeout=30000']
  * requests_cpu:4
  * requests_memory:64Gi
  * limits_memory:64Gi
  * eval_parameters
    * code:1783811010
* PostgreSQL-1-2-1-1 uses docker image postgres:18.3
  * RAM:2164173213696
  * CPU:INTEL(R) XEON(R) PLATINUM 8570
  * Cores:224
  * host:6.8.0-111-generic
  * node:cl-worker36
  * disk:1062806
  * volume_size:50G
  * volume_used:4.3G
  * cpu_list:0-223
  * args:['-c', 'max_connections=640', '-c', 'max_worker_processes=16', '-c', 'max_parallel_workers=16', '-c', 'max_parallel_workers_per_gather=8', '-c', 'max_parallel_maintenance_workers=4', '-c', 'shared_buffers=16GB', '-c', 'effective_cache_size=40GB', '-c', 'work_mem=512MB', '-c', 'maintenance_work_mem=2GB', '-c', 'autovacuum=off', '-c', 'wal_level=minimal', '-c', 'max_wal_senders=0', '-c', 'max_wal_size=32GB', '-c', 'checkpoint_timeout=1h', '-c', 'checkpoint_completion_target=1.0', '-c', 'lock_timeout=30s', '-c', 'idle_in_transaction_session_timeout=30000']
  * requests_cpu:4
  * requests_memory:64Gi
  * limits_memory:64Gi
  * eval_parameters
    * code:1783811010

### SUT Container Restarts
* bexhoma-sut-postgresql-1-1783811010-6b7d7ff4b5-bwwjj: 0 0

### Workflow

#### Actual

* DBMS PostgreSQL-1 - Experiment 1 Client 1: hammerdb (1 pods)
* DBMS PostgreSQL-1 - Experiment 2 Client 1: hammerdb (1 pods)

#### Planned

* DBMS PostgreSQL-1 - Experiment 1 Client 1: hammerdb (1 pods)
* DBMS PostgreSQL-1 - Experiment 2 Client 1: hammerdb (1 pods)

### Loading

#### Per Run

|                |   experiment_run |    SF |   time_load |   time_preload |   time_generate |   time_ingest |   time_postload |   loading_pods |   terminals | tenant_id   | type_tenants   |   num_tenants | vol_tenants   |   Throughput [SF/h] |
|:---------------|-----------------:|------:|------------:|---------------:|----------------:|--------------:|----------------:|---------------:|------------:|:------------|:---------------|--------------:|:--------------|--------------------:|
| PostgreSQL-1-1 |                1 | 16.00 |      312.00 |           1.00 |            0.00 |        140.00 |          171.00 |              1 |           8 |             | None           |             0 | False         |              184.62 |
| PostgreSQL-1-2 |                2 | 16.00 |      312.00 |           1.00 |            0.00 |        140.00 |          171.00 |              1 |           8 |             | None           |             0 | False         |              184.62 |

### Execution

#### Per Connection

| DBMS                 | phase            | job                |   experiment_run |   vusers |   client |   benchmark_run |   child |   NOPM |   TPM |   efficiency |   duration |   errors |   P95 [ms] |   P99 [ms] |
|:---------------------|:-----------------|:-------------------|-----------------:|---------:|---------:|----------------:|--------:|-------:|------:|-------------:|-----------:|---------:|-----------:|-----------:|
| PostgreSQL-1-1-1-1-1 | PostgreSQL-1-1-1 | PostgreSQL-1-1-1-1 |                1 |       16 |        1 |               1 |       1 |  15687 | 36162 |         0.00 |          5 |        0 |      75.42 |     158.19 |
| PostgreSQL-1-2-1-1-1 | PostgreSQL-1-2-1 | PostgreSQL-1-2-1-1 |                2 |       16 |        1 |               1 |       1 |  14088 | 32348 |         0.00 |          5 |        0 |     117.29 |     216.25 |

#### Per Phase

| DBMS             | phase            |   experiment_run |   vusers |   client |   benchmark_run |   pod_count |   P95 [ms] |   P99 [ms] |   efficiency |     NOPM |      TPM |   duration |   errors |
|:-----------------|:-----------------|-----------------:|---------:|---------:|----------------:|------------:|-----------:|-----------:|-------------:|---------:|---------:|-----------:|---------:|
| PostgreSQL-1-1-1 | PostgreSQL-1-1-1 |                1 |       16 |        1 |               1 |           1 |      75.42 |     158.19 |         0.00 | 15687.00 | 36162.00 |          5 |        0 |
| PostgreSQL-1-2-1 | PostgreSQL-1-2-1 |                2 |       16 |        1 |               1 |           1 |     117.29 |     216.26 |         0.00 | 14088.00 | 32348.00 |          5 |        0 |

### Tests
* TEST passed: No SUT container restarts
* TEST passed: NOPM contains no 0 or NaN
* TEST passed: Workflow as planned
The loading times for both instances of loading are the same, since both relate to the same process of ingesting into the database.
Note the added section about volume_size and volume_used in the connections section.
Also note the size descreases from first to second run (PostgreSQL does some cleaning?).
Keying and Thinking Time
We can activate waiting times before and after execution of transactions with -xkey to follow TPC-C specifications more closely.
Also also make sure, the number of driver threads (-nbt) is 10 times the number of warehouses (-sf).
The keying and thinking times can be activated via -xkey:
bexhoma hammerdb \
  -dbms PostgreSQL \
  -sf 16 \
  -xsd 20 \
  -nc 2 \
  -ne 1 \
  -nlt 8 \
  -nbp 1,2 \
  -nbt 160 \
  -xkey \
  -xlat \
  -m \
  -mc \
  -ms $BEXHOMA_MS \
  -tr \
  -lr 64Gi \
  -rr 64Gi \
  -rsr \
  -rss 50Gi \
  -rst $BEXHOMA_STORAGE_CLASS \
  -rnn $BEXHOMA_NODE_SUT -rnl $BEXHOMA_NODE_LOAD -rnb $BEXHOMA_NODE_BENCHMARK \
  run &>$LOG_DIR/docs_hammerdb_postgresql_keytime.log
Evaluate Results
docs_hammerdb_postgresql_keytime.log
## Show Summary

### Workload
HammerDB Workload SF=16 (warehouses for TPC-C)
* Type: tpcc
* Duration: 7122s
* Code: 1783812827
* HammerDB runs the benchmark.
* This experiment compares run time and resource consumption of TPC-C queries in different DBMS.
  * TPC-C data is generated and loaded using several threads.
  * Scaling factor (i.e., number of warehouses) is 16. Benchmarking runs for 20 minutes. Benchmarking has keying and thinking times activated. Benchmarking also logs latencies.
  * Experiment uses bexhoma version 0.10.4.
  * System metrics are monitored by a cluster-wide installation.
  * Experiment is limited to DBMS ['PostgreSQL'].
  * Import is handled by 1 processes (pods).
  * Loading is fixed to cl-worker19.
  * Benchmarking is fixed to cl-worker19.
  * SUT is fixed to cl-worker36.
  * Database is persisted to disk of type shared and size 50Gi. Persistent storage is removed at experiment start.
  * Loading is tested with [8] threads, split into [1] pods.
  * Benchmarking is tested with [160] threads, split into [1, 2] pods.
  * Benchmarking is run as [1] times the number of benchmarking pods.
  * Experiment is run 2 times.

### Connections
* PostgreSQL-1-1-1-1 uses docker image postgres:18.3
  * RAM:2164173213696
  * CPU:INTEL(R) XEON(R) PLATINUM 8570
  * Cores:224
  * host:6.8.0-111-generic
  * node:cl-worker36
  * disk:1062812
  * volume_size:50G
  * volume_used:3.3G
  * cpu_list:0-223
  * args:['-c', 'max_connections=640', '-c', 'max_worker_processes=16', '-c', 'max_parallel_workers=16', '-c', 'max_parallel_workers_per_gather=8', '-c', 'max_parallel_maintenance_workers=4', '-c', 'shared_buffers=16GB', '-c', 'effective_cache_size=40GB', '-c', 'work_mem=512MB', '-c', 'maintenance_work_mem=2GB', '-c', 'autovacuum=off', '-c', 'wal_level=minimal', '-c', 'max_wal_senders=0', '-c', 'max_wal_size=32GB', '-c', 'checkpoint_timeout=1h', '-c', 'checkpoint_completion_target=1.0', '-c', 'lock_timeout=30s', '-c', 'idle_in_transaction_session_timeout=30000']
  * requests_cpu:4
  * requests_memory:64Gi
  * limits_memory:64Gi
  * eval_parameters
    * code:1783812827
* PostgreSQL-1-1-2-1 uses docker image postgres:18.3
  * RAM:2164173213696
  * CPU:INTEL(R) XEON(R) PLATINUM 8570
  * Cores:224
  * host:6.8.0-111-generic
  * node:cl-worker36
  * disk:1062819
  * volume_size:50G
  * volume_used:3.3G
  * cpu_list:0-223
  * args:['-c', 'max_connections=640', '-c', 'max_worker_processes=16', '-c', 'max_parallel_workers=16', '-c', 'max_parallel_workers_per_gather=8', '-c', 'max_parallel_maintenance_workers=4', '-c', 'shared_buffers=16GB', '-c', 'effective_cache_size=40GB', '-c', 'work_mem=512MB', '-c', 'maintenance_work_mem=2GB', '-c', 'autovacuum=off', '-c', 'wal_level=minimal', '-c', 'max_wal_senders=0', '-c', 'max_wal_size=32GB', '-c', 'checkpoint_timeout=1h', '-c', 'checkpoint_completion_target=1.0', '-c', 'lock_timeout=30s', '-c', 'idle_in_transaction_session_timeout=30000']
  * requests_cpu:4
  * requests_memory:64Gi
  * limits_memory:64Gi
  * eval_parameters
    * code:1783812827
* PostgreSQL-1-2-1-1 uses docker image postgres:18.3
  * RAM:2164173213696
  * CPU:INTEL(R) XEON(R) PLATINUM 8570
  * Cores:224
  * host:6.8.0-111-generic
  * node:cl-worker36
  * disk:1062837
  * volume_size:50G
  * volume_used:3.4G
  * cpu_list:0-223
  * args:['-c', 'max_connections=640', '-c', 'max_worker_processes=16', '-c', 'max_parallel_workers=16', '-c', 'max_parallel_workers_per_gather=8', '-c', 'max_parallel_maintenance_workers=4', '-c', 'shared_buffers=16GB', '-c', 'effective_cache_size=40GB', '-c', 'work_mem=512MB', '-c', 'maintenance_work_mem=2GB', '-c', 'autovacuum=off', '-c', 'wal_level=minimal', '-c', 'max_wal_senders=0', '-c', 'max_wal_size=32GB', '-c', 'checkpoint_timeout=1h', '-c', 'checkpoint_completion_target=1.0', '-c', 'lock_timeout=30s', '-c', 'idle_in_transaction_session_timeout=30000']
  * requests_cpu:4
  * requests_memory:64Gi
  * limits_memory:64Gi
  * eval_parameters
    * code:1783812827
* PostgreSQL-1-2-2-1 uses docker image postgres:18.3
  * RAM:2164173213696
  * CPU:INTEL(R) XEON(R) PLATINUM 8570
  * Cores:224
  * host:6.8.0-111-generic
  * node:cl-worker36
  * disk:1062852
  * volume_size:50G
  * volume_used:3.4G
  * cpu_list:0-223
  * args:['-c', 'max_connections=640', '-c', 'max_worker_processes=16', '-c', 'max_parallel_workers=16', '-c', 'max_parallel_workers_per_gather=8', '-c', 'max_parallel_maintenance_workers=4', '-c', 'shared_buffers=16GB', '-c', 'effective_cache_size=40GB', '-c', 'work_mem=512MB', '-c', 'maintenance_work_mem=2GB', '-c', 'autovacuum=off', '-c', 'wal_level=minimal', '-c', 'max_wal_senders=0', '-c', 'max_wal_size=32GB', '-c', 'checkpoint_timeout=1h', '-c', 'checkpoint_completion_target=1.0', '-c', 'lock_timeout=30s', '-c', 'idle_in_transaction_session_timeout=30000']
  * requests_cpu:4
  * requests_memory:64Gi
  * limits_memory:64Gi
  * eval_parameters
    * code:1783812827

### SUT Container Restarts
* bexhoma-sut-postgresql-1-1783812827-6ddd97b4b9-dxwhb: 0 0

### Workflow

#### Actual

* DBMS PostgreSQL-1 - Experiment 1 Client 1: hammerdb (1 pods)
* DBMS PostgreSQL-1 - Experiment 1 Client 2: hammerdb (2 pods)
* DBMS PostgreSQL-1 - Experiment 2 Client 1: hammerdb (1 pods)
* DBMS PostgreSQL-1 - Experiment 2 Client 2: hammerdb (2 pods)

#### Planned

* DBMS PostgreSQL-1 - Experiment 1 Client 1: hammerdb (1 pods)
* DBMS PostgreSQL-1 - Experiment 1 Client 2: hammerdb (2 pods)
* DBMS PostgreSQL-1 - Experiment 2 Client 1: hammerdb (1 pods)
* DBMS PostgreSQL-1 - Experiment 2 Client 2: hammerdb (2 pods)

### Loading

#### Per Run

|                |   experiment_run |    SF |   time_load |   time_preload |   time_generate |   time_ingest |   time_postload |   loading_pods |   terminals | tenant_id   | type_tenants   |   num_tenants | vol_tenants   |   Throughput [SF/h] |
|:---------------|-----------------:|------:|------------:|---------------:|----------------:|--------------:|----------------:|---------------:|------------:|:------------|:---------------|--------------:|:--------------|--------------------:|
| PostgreSQL-1-1 |                1 | 16.00 |      364.00 |           1.00 |            0.00 |        160.00 |          203.00 |              1 |           8 |             | None           |             0 | False         |              158.24 |
| PostgreSQL-1-2 |                2 | 16.00 |      364.00 |           1.00 |            0.00 |        160.00 |          203.00 |              1 |           8 |             | None           |             0 | False         |              158.24 |

### Execution

#### Per Connection

| DBMS                 | phase            | job                |   experiment_run |   vusers |   client |   benchmark_run |   child |   NOPM |   TPM |   efficiency |   duration |   errors |
|:---------------------|:-----------------|:-------------------|-----------------:|---------:|---------:|----------------:|--------:|-------:|------:|-------------:|-----------:|---------:|
| PostgreSQL-1-1-1-1-1 | PostgreSQL-1-1-1 | PostgreSQL-1-1-1-1 |                1 |      160 |        1 |               1 |       1 |    201 |   468 |        97.69 |         20 |        0 |
| PostgreSQL-1-1-2-1-2 | PostgreSQL-1-1-2 | PostgreSQL-1-1-2-1 |                1 |       80 |        2 |               1 |       2 |    199 |   458 |         0.00 |         20 |        0 |
| PostgreSQL-1-1-2-1-1 | PostgreSQL-1-1-2 | PostgreSQL-1-1-2-1 |                1 |       80 |        2 |               1 |       1 |    198 |   458 |         0.00 |         20 |        0 |
| PostgreSQL-1-2-1-1-1 | PostgreSQL-1-2-1 | PostgreSQL-1-2-1-1 |                2 |      160 |        1 |               1 |       1 |    201 |   465 |        97.69 |         20 |        0 |
| PostgreSQL-1-2-2-1-1 | PostgreSQL-1-2-2 | PostgreSQL-1-2-2-1 |                2 |       80 |        2 |               1 |       1 |    200 |   458 |         0.00 |         20 |        0 |
| PostgreSQL-1-2-2-1-2 | PostgreSQL-1-2-2 | PostgreSQL-1-2-2-1 |                2 |       80 |        2 |               1 |       2 |    200 |   458 |         0.00 |         20 |        0 |

#### Per Phase

| DBMS             | phase            |   experiment_run |   vusers |   client |   benchmark_run |   pod_count |   efficiency |   NOPM |    TPM |   duration |   errors |
|:-----------------|:-----------------|-----------------:|---------:|---------:|----------------:|------------:|-------------:|-------:|-------:|-----------:|---------:|
| PostgreSQL-1-1-1 | PostgreSQL-1-1-1 |                1 |      160 |        1 |               1 |           1 |        97.69 | 201.00 | 468.00 |         20 |        0 |
| PostgreSQL-1-1-2 | PostgreSQL-1-1-2 |                1 |      160 |        2 |               1 |           2 |        96.47 | 198.50 | 458.00 |         20 |        0 |
| PostgreSQL-1-2-1 | PostgreSQL-1-2-1 |                2 |      160 |        1 |               1 |           1 |        97.69 | 201.00 | 465.00 |         20 |        0 |
| PostgreSQL-1-2-2 | PostgreSQL-1-2-2 |                2 |      160 |        2 |               1 |           2 |        97.20 | 200.00 | 458.00 |         20 |        0 |

### Monitoring

### Loading phase: SUT deployment

| DBMS               |   CPU [CPUs] |   Max CPU |   Max RAM [Gb] |   Max RAM Cached [Gb] |
|:-------------------|-------------:|----------:|---------------:|----------------------:|
| PostgreSQL-1-1-1-1 |        34.60 |      0.26 |           1.69 |                  3.23 |
| PostgreSQL-1-1-2-1 |        34.60 |      0.26 |           1.69 |                  3.23 |

### Loading phase: component loader

| DBMS               |   CPU [CPUs] |   Max CPU |   Max RAM [Gb] |   Max RAM Cached [Gb] |
|:-------------------|-------------:|----------:|---------------:|----------------------:|
| PostgreSQL-1-1-1-1 |       320.41 |      5.77 |           0.09 |                  0.09 |
| PostgreSQL-1-1-2-1 |       320.41 |      5.77 |           0.09 |                  0.09 |

### Execution phase: SUT deployment

| DBMS               |   CPU [CPUs] |   Max CPU |   Max RAM [Gb] |   Max RAM Cached [Gb] |
|:-------------------|-------------:|----------:|---------------:|----------------------:|
| PostgreSQL-1-1-1-1 |        14.79 |      0.02 |           2.73 |                  4.33 |
| PostgreSQL-1-1-2-1 |        14.74 |      0.05 |           2.88 |                  4.50 |
| PostgreSQL-1-2-1-1 |        16.50 |      0.04 |           1.61 |                  3.11 |
| PostgreSQL-1-2-2-1 |        15.53 |      0.03 |           1.97 |                  3.55 |

### Execution phase: component benchmarker

| DBMS               |   CPU [CPUs] |   Max CPU |   Max RAM [Gb] |   Max RAM Cached [Gb] |
|:-------------------|-------------:|----------:|---------------:|----------------------:|
| PostgreSQL-1-1-1-1 |        22.86 |      0.14 |           0.63 |                  0.63 |
| PostgreSQL-1-1-2-1 |        22.86 |      0.14 |           0.62 |                  0.63 |
| PostgreSQL-1-2-1-1 |        21.94 |      0.07 |           0.63 |                  0.63 |
| PostgreSQL-1-2-2-1 |        21.94 |      0.12 |           0.63 |                  0.63 |

### Tests
* TEST passed: No SUT container restarts
* TEST passed: Loading phase: SUT deployment contains no 0 or NaN in CPU [CPUs]
* TEST passed: Loading phase: component loader contains no 0 or NaN in CPU [CPUs]
* TEST passed: Execution phase: SUT deployment contains no 0 or NaN in CPU [CPUs]
* TEST passed: Execution phase: component benchmarker contains no 0 or NaN in CPU [CPUs]
* TEST passed: NOPM contains no 0 or NaN
* TEST passed: Workflow as planned
Now also efficiency is computed via 100. * NOPM / 12.86 / sf, when number of client threads is 10 times the number of warehouses:
100 makes it a percentage value
NOPM is the number of new orders per minute
sf is the number of warehouses
12.86 is the theoretical limit in the TPC-C speficications
Note that these are statistical values.