Example: Benchmark PGBouncer
This differs from the default behaviour of bexhoma, since we benchmark a DBMS with a pooling component, that can be managed by bexhoma and exists in the Kubernetes cluster in the same namespace.
PgBouncer [1] is a lightweight and high-performance connection pooler for PostgreSQL. It manages and reuses database connections to reduce the overhead of frequent connection creation, which is especially useful for applications with high concurrency or short-lived queries. By sitting between your application and the PostgreSQL server, PgBouncer helps improve scalability, reduce resource usage, and optimize connection handling. We use the Docker image provided by [2].
The results are not official benchmark results. Exact performance depends on a number of parameters. You may get different results. These examples are solely to illustrate how to use bexhoma and show the result evaluation.
References:
PGBouncer: https://www.pgbouncer.org/
PGBouncer Docker Container: https://hub.docker.com/r/edoburu/pgbouncer/
YCSB Repository: https://github.com/brianfrankcooper/YCSB/wiki/Running-a-Workload
Benchmarking cloud serving systems with YCSB: https://dl.acm.org/doi/10.1145/1807128.1807152
Orchestrating DBMS Benchmarking in the Cloud with Kubernetes: https://doi.org/10.1007/978-3-030-94437-7_6
A Cloud-Native Adoption of Classical DBMS Performance Benchmarks and Tools: https://doi.org/10.1007/978-3-031-68031-1_9
Perform YCSB Benchmark - Ingestion of Data Included
You will have to change the node selectors there (to names of nodes, that exist in your cluster - or to leave out the corresponding parameters):
BEXHOMA_NODE_SUT="cl-worker11"
BEXHOMA_NODE_LOAD="cl-worker19"
BEXHOMA_NODE_BENCHMARK="cl-worker19"
LOG_DIR="./logs_tests"
BEXHOMA_MS=1
BEXHOMA_STORAGE_CLASS="shared"

mkdir -p $LOG_DIR
For performing the experiment we can run the ycsb file.
Example:
bexhoma ycsb \
  -dbms PGBouncer \
  -sf 16 \
  -xwl c \
  -xtb 16384 \
  -xnbf 11 \
  -xnlf 11 \
  -nc 1 \
  -ne 1 \
  -nlp 16 \
  -nlt 64 \
  -nbp 16 \
  -nbt 128 \
  -xnpp 4 \
  -xnpi 128 \
  -xnpo 64 \
  -xop 16 \
  -m \
  -mc \
  -ms $BEXHOMA_MS \
  -tr \
  -lr 64Gi \
  -rr 64Gi \
  -rss 80Gi \
  -rnn $BEXHOMA_NODE_SUT -rnl $BEXHOMA_NODE_LOAD -rnb $BEXHOMA_NODE_BENCHMARK \
  run &>$LOG_DIR/docs_ycsb_pgbouncer_1.log
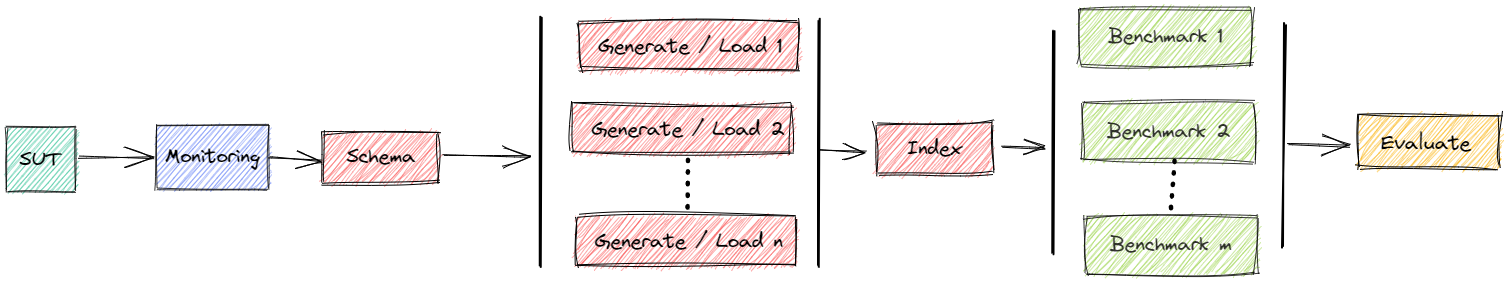
This
loops over
nin [16] andtin [11]starts a clean instance of PostgreSQL with PGBouncer (
-dbms)data directory inside a Docker container
creates YCSB schema in each database
starts
nloader pods per DBMSwith a loading container each
threads = 64/
n(-nlt)target throughput is
t* 16384generates YCSB data = 16.000.000 rows (i.e., SF=16,
-sf)imports it into the DBMS
loops over
min [16] andsin [11]runs
mparallel streams of YCSB queries per DBMS16.000.000 operations (
-xop)workload C = 100% (
--workload)target throughput is
s* 16384threads = 64/
m(-nbt)PGBouncer has 4 instances (
-xnpp) with 128 inbound connections (-xnpi) and 64 outbound connections (-xnpo)
with a maximum of 1 DBMS per time (
-ms)
tests if results match workflow (
-tr)monitors (
-m) all components (-mc)shows a summary
Status
You can watch the status while benchmark is running via bexhoma status
Dashboard: Running
Cluster Prometheus: Running
Message Queue: Running
Data directory: Running
Result directory: Running
+-----------------+--------------+--------------+------------+-------------+--------------+
| 1745062608      | sut          |   loaded [s] | use case   | pool        | loading      |
+=================+==============+==============+============+=============+==============+
| pgb-64-4-128-64 | (1. Running) |            3 | ycsb       | 4 (Running) | (16 Running) |
+-----------------+--------------+--------------+------------+-------------+--------------+
The code 1745062608 is the unique identifier of the experiment.
You can find the number also in the output of ycsb.py.
Cleanup
The script is supposed to clean up and remove everything from the cluster that is related to the experiment after finishing.
If something goes wrong, you can also clean up manually with bexperiment stop (removes everything) or bexperiment stop -e 1745062608 (removes everything that is related to experiment 1745062608).
Evaluate Results
At the end of a benchmark you will see a summary like
docs_ycsb_pgbouncer_1.log
## Show Summary
### Workload
YCSB SF=16
* Type: ycsb
* Duration: 1143s
* Code: 1782369432
* YCSB driver runs the experiment.
* This experiment compares run time and resource consumption of YCSB queries.
* Workload is 'C'.
* Number of rows to insert is 16000000.
* Ordering of inserts is hashed.
* Number of operations is 16000000.
* Batch size is ''.
* Target is based on multiples of '16384'.
* Factors for loading are [11].
* Factors for benchmarking are [11].
* Experiment uses bexhoma version 0.10.0.
* System metrics are monitored by a cluster-wide installation.
* Experiment is limited to DBMS ['PGBouncer'].
* Import is handled by 16 processes (pods).
* Loading is fixed to cl-worker19.
* Benchmarking is fixed to cl-worker19.
* SUT is fixed to cl-worker38.
* Loading is tested with [64] threads, split into [16] pods.
* Benchmarking is tested with [128] threads, split into [16] pods.
* Pooling is done with [4] pods having [128] inbound and [64] outbound connections in total.
* Benchmarking is run as [1] times the number of benchmarking pods.
* Experiment is run once.
### Connections
* PGBouncer-1-1-1-1 uses docker image postgres:18.3
* RAM:540492877824
* CPU:Intel(R) Xeon(R) Gold 6430
* Cores:128
* host:6.8.0-111-generic
* node:cl-worker38
* disk:258673
* cpu_list:0-127
* args:['-c', 'max_worker_processes=64', '-c', 'max_parallel_workers=64', '-c', 'max_parallel_workers_per_gather=64', '-c', 'max_parallel_maintenance_workers=64', '-c', 'max_wal_size=32GB', '-c', 'shared_buffers=64GB', '-c', 'max_connections=2048', '-c', 'autovacuum_max_workers=10', '-c', 'autovacuum_vacuum_cost_limit=3000', '-c', 'vacuum_cost_limit=1000', '-c', 'checkpoint_completion_target=0.9', '-c', 'cpu_tuple_cost=0.03', '-c', 'effective_cache_size=64GB', '-c', 'maintenance_work_mem=2GB', '-c', 'wal_buffers=1GB', '-c', 'work_mem=32GB', '-c', 'temp_buffers=4GB', '-c', 'autovacuum_work_mem=-1', '-c', 'max_stack_depth=7MB', '-c', 'max_files_per_process=4000', '-c', 'effective_io_concurrency=32', '-c', 'wal_level=minimal', '-c', 'max_wal_senders=0', '-c', 'synchronous_commit=off', '-c', 'checkpoint_timeout=1h', '-c', 'checkpoint_warning=0', '-c', 'autovacuum=off', '-c', 'max_locks_per_transaction=64', '-c', 'max_pred_locks_per_transaction=64', '-c', 'default_statistics_target=1000', '-c', 'random_page_cost=60']
* requests_cpu:4
* requests_memory:64Gi
* limits_memory:64Gi
* eval_parameters
* code:1782369432
### Workflow
#### Actual
* DBMS PGBouncer-1 - Experiment 1 Client 1: ycsb (16 pods)
#### Planned
* DBMS PGBouncer-1 - Experiment 1 Client 1: ycsb (16 pods)
### Loading
#### Per Connection
| connection | experiment_run | threads | target | pod_count | exceptions | [OVERALL].Throughput(ops/sec) | [OVERALL].RunTime(ms) | [INSERT].Return=OK | [INSERT].99thPercentileLatency(us) | sf | Throughput [SF/h] |
|:---------------------|-----------------:|----------:|---------:|------------:|-------------:|--------------------------------:|------------------------:|---------------------:|-------------------------------------:|------:|--------------------:|
| PGBouncer-1-1-0-1-1 | 1.00 | 4.00 | 11264.00 | 16.00 | 0.00 | 3751.28 | 266576.00 | 1000000.00 | 2887.00 | 16.00 | 216.07 |
| PGBouncer-1-1-0-1-2 | 1.00 | 4.00 | 11264.00 | 16.00 | 0.00 | 3690.23 | 270986.00 | 1000000.00 | 2253.00 | 16.00 | 212.56 |
| PGBouncer-1-1-0-1-3 | 1.00 | 4.00 | 11264.00 | 16.00 | 0.00 | 4314.70 | 231766.00 | 1000000.00 | 2443.00 | 16.00 | 248.53 |
| PGBouncer-1-1-0-1-4 | 1.00 | 4.00 | 11264.00 | 16.00 | 0.00 | 4097.49 | 244052.00 | 1000000.00 | 2559.00 | 16.00 | 236.02 |
| PGBouncer-1-1-0-1-5 | 1.00 | 4.00 | 11264.00 | 16.00 | 0.00 | 4050.09 | 246908.00 | 1000000.00 | 2177.00 | 16.00 | 233.29 |
| PGBouncer-1-1-0-1-6 | 1.00 | 4.00 | 11264.00 | 16.00 | 0.00 | 3703.66 | 270003.00 | 1000000.00 | 2389.00 | 16.00 | 213.33 |
| PGBouncer-1-1-0-1-7 | 1.00 | 4.00 | 11264.00 | 16.00 | 0.00 | 3816.07 | 262050.00 | 1000000.00 | 2521.00 | 16.00 | 219.81 |
| PGBouncer-1-1-0-1-8 | 1.00 | 4.00 | 11264.00 | 16.00 | 0.00 | 4097.32 | 244062.00 | 1000000.00 | 2647.00 | 16.00 | 236.01 |
| PGBouncer-1-1-0-1-9 | 1.00 | 4.00 | 11264.00 | 16.00 | 0.00 | 4138.23 | 241649.00 | 1000000.00 | 2611.00 | 16.00 | 238.36 |
| PGBouncer-1-1-0-1-10 | 1.00 | 4.00 | 11264.00 | 16.00 | 0.00 | 3710.37 | 269515.00 | 1000000.00 | 2483.00 | 16.00 | 213.72 |
| PGBouncer-1-1-0-1-11 | 1.00 | 4.00 | 11264.00 | 16.00 | 0.00 | 3782.28 | 264391.00 | 1000000.00 | 2605.00 | 16.00 | 217.86 |
| PGBouncer-1-1-0-1-12 | 1.00 | 4.00 | 11264.00 | 16.00 | 0.00 | 3798.63 | 263253.00 | 1000000.00 | 2861.00 | 16.00 | 218.80 |
| PGBouncer-1-1-0-1-13 | 1.00 | 4.00 | 11264.00 | 16.00 | 0.00 | 3655.36 | 273571.00 | 1000000.00 | 2503.00 | 16.00 | 210.55 |
| PGBouncer-1-1-0-1-14 | 1.00 | 4.00 | 11264.00 | 16.00 | 0.00 | 3729.70 | 268118.00 | 1000000.00 | 2461.00 | 16.00 | 214.83 |
| PGBouncer-1-1-0-1-15 | 1.00 | 4.00 | 11264.00 | 16.00 | 0.00 | 3698.92 | 270349.00 | 1000000.00 | 2363.00 | 16.00 | 213.06 |
| PGBouncer-1-1-0-1-16 | 1.00 | 4.00 | 11264.00 | 16.00 | 0.00 | 3725.07 | 268451.00 | 1000000.00 | 2441.00 | 16.00 | 214.56 |
#### Per Run
| DBMS | experiment_run | threads | target | pod_count | exceptions | sf | Throughput [SF/h] | [OVERALL].Throughput(ops/sec) | [OVERALL].RunTime(ms) | [INSERT].Return=OK | [INSERT].99thPercentileLatency(us) |
|:--------------|-----------------:|----------:|----------:|------------:|-------------:|------:|--------------------:|--------------------------------:|------------------------:|---------------------:|-------------------------------------:|
| PGBouncer-1-1 | 1.00 | 64.00 | 180224.00 | 16.00 | 0.00 | 16.00 | 210.55 | 61759.39 | 273571.00 | 16000000.00 | 2512.75 |
### Execution
#### Per Connection
| DBMS | phase | job | configuration | experiment_run | client | benchmark_run | child | threads | target | pod_count | exceptions | [OVERALL].Throughput(ops/sec) | [OVERALL].RunTime(ms) | [READ].Return=OK | [READ].99thPercentileLatency(us) |
|:---------------------|:----------------|:------------------|:----------------|-----------------:|---------:|----------------:|--------:|----------:|---------:|------------:|-------------:|--------------------------------:|------------------------:|-------------------:|-----------------------------------:|
| PGBouncer-1-1-1-1-13 | PGBouncer-1-1-1 | PGBouncer-1-1-1-1 | PGBouncer-1 | 1 | 1 | 1 | 13 | 8 | 11264 | 16 | 0 | 3936.42 | 254038.00 | 1000000 | 2197.00 |
| PGBouncer-1-1-1-1-2 | PGBouncer-1-1-1 | PGBouncer-1-1-1-1 | PGBouncer-1 | 1 | 1 | 1 | 2 | 8 | 11264 | 16 | 0 | 3917.91 | 255238.00 | 1000000 | 2283.00 |
| PGBouncer-1-1-1-1-6 | PGBouncer-1-1-1 | PGBouncer-1-1-1-1 | PGBouncer-1 | 1 | 1 | 1 | 6 | 8 | 11264 | 16 | 0 | 3900.70 | 256364.00 | 1000000 | 2383.00 |
| PGBouncer-1-1-1-1-1 | PGBouncer-1-1-1 | PGBouncer-1-1-1-1 | PGBouncer-1 | 1 | 1 | 1 | 1 | 8 | 11264 | 16 | 0 | 3910.74 | 255706.00 | 1000000 | 2377.00 |
| PGBouncer-1-1-1-1-9 | PGBouncer-1-1-1 | PGBouncer-1-1-1-1 | PGBouncer-1 | 1 | 1 | 1 | 9 | 8 | 11264 | 16 | 0 | 4067.36 | 245860.00 | 1000000 | 2191.00 |
| PGBouncer-1-1-1-1-8 | PGBouncer-1-1-1 | PGBouncer-1-1-1-1 | PGBouncer-1 | 1 | 1 | 1 | 8 | 8 | 11264 | 16 | 0 | 3915.27 | 255410.00 | 1000000 | 2283.00 |
| PGBouncer-1-1-1-1-16 | PGBouncer-1-1-1 | PGBouncer-1-1-1-1 | PGBouncer-1 | 1 | 1 | 1 | 16 | 8 | 11264 | 16 | 0 | 4056.61 | 246511.00 | 1000000 | 2251.00 |
| PGBouncer-1-1-1-1-4 | PGBouncer-1-1-1 | PGBouncer-1-1-1-1 | PGBouncer-1 | 1 | 1 | 1 | 4 | 8 | 11264 | 16 | 0 | 3895.57 | 256702.00 | 1000000 | 2345.00 |
| PGBouncer-1-1-1-1-5 | PGBouncer-1-1-1 | PGBouncer-1-1-1-1 | PGBouncer-1 | 1 | 1 | 1 | 5 | 8 | 11264 | 16 | 0 | 3888.16 | 257191.00 | 1000000 | 2405.00 |
| PGBouncer-1-1-1-1-12 | PGBouncer-1-1-1 | PGBouncer-1-1-1-1 | PGBouncer-1 | 1 | 1 | 1 | 12 | 8 | 11264 | 16 | 0 | 3898.10 | 256535.00 | 1000000 | 2373.00 |
| PGBouncer-1-1-1-1-3 | PGBouncer-1-1-1 | PGBouncer-1-1-1-1 | PGBouncer-1 | 1 | 1 | 1 | 3 | 8 | 11264 | 16 | 0 | 3910.70 | 255709.00 | 1000000 | 2199.00 |
| PGBouncer-1-1-1-1-10 | PGBouncer-1-1-1 | PGBouncer-1-1-1-1 | PGBouncer-1 | 1 | 1 | 1 | 10 | 8 | 11264 | 16 | 0 | 3911.98 | 255625.00 | 1000000 | 2189.00 |
| PGBouncer-1-1-1-1-11 | PGBouncer-1-1-1 | PGBouncer-1-1-1-1 | PGBouncer-1 | 1 | 1 | 1 | 11 | 8 | 11264 | 16 | 0 | 3910.57 | 255717.00 | 1000000 | 2259.00 |
| PGBouncer-1-1-1-1-7 | PGBouncer-1-1-1 | PGBouncer-1-1-1-1 | PGBouncer-1 | 1 | 1 | 1 | 7 | 8 | 11264 | 16 | 0 | 3915.32 | 255407.00 | 1000000 | 2375.00 |
| PGBouncer-1-1-1-1-15 | PGBouncer-1-1-1 | PGBouncer-1-1-1-1 | PGBouncer-1 | 1 | 1 | 1 | 15 | 8 | 11264 | 16 | 0 | 3919.95 | 255105.00 | 1000000 | 2303.00 |
| PGBouncer-1-1-1-1-14 | PGBouncer-1-1-1 | PGBouncer-1-1-1-1 | PGBouncer-1 | 1 | 1 | 1 | 14 | 8 | 11264 | 16 | 0 | 3920.46 | 255072.00 | 1000000 | 2237.00 |
#### Per Phase
| DBMS | phase | experiment_run | threads | target | benchmark_run | pod_count | exceptions | [OVERALL].Throughput(ops/sec) | [OVERALL].RunTime(ms) | [READ].Return=OK | [READ].99thPercentileLatency(us) |
|:----------------|:----------------|-----------------:|----------:|---------:|----------------:|------------:|-------------:|--------------------------------:|------------------------:|-------------------:|-----------------------------------:|
| PGBouncer-1-1-1 | PGBouncer-1-1-1 | 1 | 128 | 180224 | 1 | 16 | 0 | 62875.84 | 257191.00 | 16000000 | 2405.00 |
### Monitoring
### Loading phase: component pool
| DBMS | CPU [CPUs] | Max CPU | Max RAM [Gb] | Max RAM Cached [Gb] |
|:------------------|-------------:|----------:|---------------:|----------------------:|
| PGBouncer-1-1-1-1 | 0.20 | 0.00 | 0.04 | 0.04 |
### Loading phase: SUT deployment
| DBMS | CPU [CPUs] | Max CPU | Max RAM [Gb] | Max RAM Cached [Gb] |
|:------------------|-------------:|----------:|---------------:|----------------------:|
| PGBouncer-1-1-1-1 | 2564.84 | 11.43 | 24.59 | 42.86 |
### Loading phase: component loader
| DBMS | CPU [CPUs] | Max CPU | Max RAM [Gb] | Max RAM Cached [Gb] |
|:------------------|-------------:|----------:|---------------:|----------------------:|
| PGBouncer-1-1-1-1 | 1285.94 | 7.41 | 0.11 | 0.11 |
### Execution phase: component pool
| DBMS | CPU [CPUs] | Max CPU | Max RAM [Gb] | Max RAM Cached [Gb] |
|:------------------|-------------:|----------:|---------------:|----------------------:|
| PGBouncer-1-1-1-1 | 0.08 | 0.00 | 0.04 | 0.04 |
### Execution phase: SUT deployment
| DBMS | CPU [CPUs] | Max CPU | Max RAM [Gb] | Max RAM Cached [Gb] |
|:------------------|-------------:|----------:|---------------:|----------------------:|
| PGBouncer-1-1-1-1 | 1854.47 | 9.35 | 26.74 | 45.01 |
### Execution phase: component benchmarker
| DBMS | CPU [CPUs] | Max CPU | Max RAM [Gb] | Max RAM Cached [Gb] |
|:------------------|-------------:|----------:|---------------:|----------------------:|
| PGBouncer-1-1-1-1 | 1098.41 | 6.88 | 0.11 | 0.11 |
### Tests
* TEST passed: Loading phase: component pool contains no 0 or NaN in CPU [CPUs]
* TEST passed: Loading phase: SUT deployment contains no 0 or NaN in CPU [CPUs]
* TEST passed: Loading phase: component loader contains no 0 or NaN in CPU [CPUs]
* TEST passed: Execution phase: component pool contains no 0 or NaN in CPU [CPUs]
* TEST passed: Execution phase: SUT deployment contains no 0 or NaN in CPU [CPUs]
* TEST passed: Execution phase: component benchmarker contains no 0 or NaN in CPU [CPUs]
* TEST passed: Loading Phase: [OVERALL].Throughput(ops/sec) contains no 0 or NaN
* TEST passed: Execution Phase: [OVERALL].Throughput(ops/sec) contains no 0 or NaN
* TEST passed: Workflow as planned
* TEST passed: Execution Phase: contains no FAILED column
To see the summary again you can simply call bexhoma summary -e 1745062608 with the experiment code.
Detailed Evaluation
Results are transformed into pandas DataFrames and can be inspected in detail. See for example
You can connect to an evaluation server locally by bexhoma jupyter.
This forwards ports, so you have
a Jupyter notebook server at http://localhost:8888
Monitoring
Monitoring can be activated for DBMS only (-m) or for all components (-mc).
All metrics in monitoring are summed across all matching components. In this example, this means that used memory, CPU time, etc. are summed across all 4 pods of PGBouncer.
Use Persistent Storage
The default behaviour of bexhoma is that the database is stored inside the ephemeral storage of the Docker container. If your cluster allows dynamic provisioning of volumes, you might request a persistent storage of a certain type (storageClass) and size.
Example:
bexhoma ycsb \
  -dbms PGBouncer \
  -sf 16 \
  -xwl c \
  -xtb 16384 \
  -xnbf 11 \
  -xnlf 11 \
  -nc 2 \
  -ne 1 \
  -nlp 16 \
  -nlt 64 \
  -nbp 16 \
  -nbt 128 \
  -xnpp 4 \
  -xnpi 128 \
  -xnpo 64 \
  -xop 16 \
  -m \
  -mc \
  -ms $BEXHOMA_MS \
  -tr \
  -lr 64Gi \
  -rr 64Gi \
  -rsr \
  -rss 100Gi \
  -rst $BEXHOMA_STORAGE_CLASS \
  -rnn $BEXHOMA_NODE_SUT -rnl $BEXHOMA_NODE_LOAD -rnb $BEXHOMA_NODE_BENCHMARK \
  run &>$LOG_DIR/docs_ycsb_pgbouncer_2.log
The following status shows we have one volume of type shared.
Every PGBouncer experiment (and every PostgreSQL experiment) will take the database from this volume and skip loading.
This makes the database persistent.
PGBouncer itself is stateless.
In this example -nc is set to two, that is the complete experiment is repeated twice for statistical confidence.
The first instance of the experiment mounts the volume and generates the data.
All other instances just use the database without generating and loading data.
+----------------------------------------------+-----------------+--------------------+--------------+-------------------+-----------------+----------------------+-----------+----------+--------+--------+
| Volumes                                      | configuration   | experiment         | loaded [s]   |   timeLoading [s] | dbms            | storage_class_name   | storage   | status   | size   | used   |
+==============================================+=================+====================+==============+===================+=================+======================+===========+==========+========+========+
| bexhoma-storage-postgresql-ycsb-16           | postgresql      | ycsb-16            | True         |               734 | PGBouncer       | shared               | 100Gi     | Bound    | 100G   | 38G    |
+----------------------------------------------+-----------------+--------------------+--------------+-------------------+-----------------+----------------------+-----------+----------+--------+--------+
The result looks something like
docs_ycsb_pgbouncer_2.log
## Show Summary
### Workload
YCSB SF=16
* Type: ycsb
* Duration: 2165s
* Code: 1782220193
* YCSB driver runs the experiment.
* This experiment compares run time and resource consumption of YCSB queries.
* Workload is 'C'.
* Number of rows to insert is 16000000.
* Ordering of inserts is hashed.
* Number of operations is 16000000.
* Batch size is ''.
* Target is based on multiples of '16384'.
* Factors for loading are [11].
* Factors for benchmarking are [11].
* Experiment uses bexhoma version 0.10.0.
* System metrics are monitored by a cluster-wide installation.
* Experiment is limited to DBMS ['PGBouncer'].
* Import is handled by 16 processes (pods).
* Loading is fixed to cl-worker19.
* Benchmarking is fixed to cl-worker19.
* SUT is fixed to cl-worker38.
* Database is persisted to disk of type shared and size 100Gi. Persistent storage is removed at experiment start.
* Loading is tested with [64] threads, split into [16] pods.
* Benchmarking is tested with [128] threads, split into [16] pods.
* Pooling is done with [4] pods having [128] inbound and [64] outbound connections in total.
* Benchmarking is run as [1] times the number of benchmarking pods.
* Experiment is run 2 times.
### Connections
* PGBouncer-1-1-1-1 uses docker image postgres:18.3
* RAM:540492877824
* CPU:Intel(R) Xeon(R) Gold 6430
* Cores:128
* host:6.8.0-111-generic
* node:cl-worker38
* disk:263095
* datadisk:38196
* volume_size:100G
* volume_used:38G
* cpu_list:0-127
* args:['-c', 'max_worker_processes=64', '-c', 'max_parallel_workers=64', '-c', 'max_parallel_workers_per_gather=64', '-c', 'max_parallel_maintenance_workers=64', '-c', 'max_wal_size=32GB', '-c', 'shared_buffers=64GB', '-c', 'max_connections=2048', '-c', 'autovacuum_max_workers=10', '-c', 'autovacuum_vacuum_cost_limit=3000', '-c', 'vacuum_cost_limit=1000', '-c', 'checkpoint_completion_target=0.9', '-c', 'cpu_tuple_cost=0.03', '-c', 'effective_cache_size=64GB', '-c', 'maintenance_work_mem=2GB', '-c', 'wal_buffers=1GB', '-c', 'work_mem=32GB', '-c', 'temp_buffers=4GB', '-c', 'autovacuum_work_mem=-1', '-c', 'max_stack_depth=7MB', '-c', 'max_files_per_process=4000', '-c', 'effective_io_concurrency=32', '-c', 'wal_level=minimal', '-c', 'max_wal_senders=0', '-c', 'synchronous_commit=off', '-c', 'checkpoint_timeout=1h', '-c', 'checkpoint_warning=0', '-c', 'autovacuum=off', '-c', 'max_locks_per_transaction=64', '-c', 'max_pred_locks_per_transaction=64', '-c', 'default_statistics_target=1000', '-c', 'random_page_cost=60']
* requests_cpu:4
* requests_memory:64Gi
* limits_memory:64Gi
* eval_parameters
* code:1782220193
* PGBouncer-1-2-1-1 uses docker image postgres:18.3
* RAM:540492877824
* CPU:Intel(R) Xeon(R) Gold 6430
* Cores:128
* host:6.8.0-111-generic
* node:cl-worker38
* disk:263219
* datadisk:38196
* volume_size:100G
* volume_used:38G
* cpu_list:0-127
* args:['-c', 'max_worker_processes=64', '-c', 'max_parallel_workers=64', '-c', 'max_parallel_workers_per_gather=64', '-c', 'max_parallel_maintenance_workers=64', '-c', 'max_wal_size=32GB', '-c', 'shared_buffers=64GB', '-c', 'max_connections=2048', '-c', 'autovacuum_max_workers=10', '-c', 'autovacuum_vacuum_cost_limit=3000', '-c', 'vacuum_cost_limit=1000', '-c', 'checkpoint_completion_target=0.9', '-c', 'cpu_tuple_cost=0.03', '-c', 'effective_cache_size=64GB', '-c', 'maintenance_work_mem=2GB', '-c', 'wal_buffers=1GB', '-c', 'work_mem=32GB', '-c', 'temp_buffers=4GB', '-c', 'autovacuum_work_mem=-1', '-c', 'max_stack_depth=7MB', '-c', 'max_files_per_process=4000', '-c', 'effective_io_concurrency=32', '-c', 'wal_level=minimal', '-c', 'max_wal_senders=0', '-c', 'synchronous_commit=off', '-c', 'checkpoint_timeout=1h', '-c', 'checkpoint_warning=0', '-c', 'autovacuum=off', '-c', 'max_locks_per_transaction=64', '-c', 'max_pred_locks_per_transaction=64', '-c', 'default_statistics_target=1000', '-c', 'random_page_cost=60']
* requests_cpu:4
* requests_memory:64Gi
* limits_memory:64Gi
* eval_parameters
* code:1782220193
### Workflow
#### Actual
* DBMS PGBouncer-1 - Experiment 1 Client 1: ycsb (16 pods)
* DBMS PGBouncer-1 - Experiment 2 Client 1: ycsb (16 pods)
#### Planned
* DBMS PGBouncer-1 - Experiment 1 Client 1: ycsb (16 pods)
* DBMS PGBouncer-1 - Experiment 2 Client 1: ycsb (16 pods)
### Loading
#### Per Connection
| connection | experiment_run | threads | target | pod_count | exceptions | [OVERALL].Throughput(ops/sec) | [OVERALL].RunTime(ms) | [INSERT].Return=OK | [INSERT].99thPercentileLatency(us) | sf | Throughput [SF/h] |
|:---------------------|-----------------:|----------:|---------:|------------:|-------------:|--------------------------------:|------------------------:|---------------------:|-------------------------------------:|------:|--------------------:|
| PGBouncer-1-1-0-1-1 | 1.00 | 4.00 | 11264.00 | 16.00 | 0.00 | 2795.52 | 357715.00 | 1000000.00 | 1875.00 | 16.00 | 161.02 |
| PGBouncer-1-1-0-1-2 | 1.00 | 4.00 | 11264.00 | 16.00 | 0.00 | 4413.32 | 226587.00 | 1000000.00 | 1834.00 | 16.00 | 254.21 |
| PGBouncer-1-1-0-1-3 | 1.00 | 4.00 | 11264.00 | 16.00 | 0.00 | 2776.53 | 360162.00 | 1000000.00 | 1947.00 | 16.00 | 159.93 |
| PGBouncer-1-1-0-1-4 | 1.00 | 4.00 | 11264.00 | 16.00 | 0.00 | 2767.12 | 361387.00 | 1000000.00 | 1934.00 | 16.00 | 159.39 |
| PGBouncer-1-1-0-1-5 | 1.00 | 4.00 | 11264.00 | 16.00 | 0.00 | 2798.85 | 357290.00 | 1000000.00 | 1923.00 | 16.00 | 161.21 |
| PGBouncer-1-1-0-1-6 | 1.00 | 4.00 | 11264.00 | 16.00 | 0.00 | 2777.11 | 360086.00 | 1000000.00 | 1895.00 | 16.00 | 159.96 |
| PGBouncer-1-1-0-1-7 | 1.00 | 4.00 | 11264.00 | 16.00 | 0.00 | 2787.59 | 358733.00 | 1000000.00 | 1869.00 | 16.00 | 160.57 |
| PGBouncer-1-1-0-1-8 | 1.00 | 4.00 | 11264.00 | 16.00 | 0.00 | 2748.22 | 363872.00 | 1000000.00 | 1994.00 | 16.00 | 158.30 |
| PGBouncer-1-1-0-1-9 | 1.00 | 4.00 | 11264.00 | 16.00 | 0.00 | 2765.98 | 361535.00 | 1000000.00 | 1953.00 | 16.00 | 159.32 |
| PGBouncer-1-1-0-1-10 | 1.00 | 4.00 | 11264.00 | 16.00 | 0.00 | 3456.27 | 289329.00 | 1000000.00 | 1866.00 | 16.00 | 199.08 |
| PGBouncer-1-1-0-1-11 | 1.00 | 4.00 | 11264.00 | 16.00 | 0.00 | 2783.65 | 359241.00 | 1000000.00 | 1925.00 | 16.00 | 160.34 |
| PGBouncer-1-1-0-1-12 | 1.00 | 4.00 | 11264.00 | 16.00 | 0.00 | 2760.98 | 362190.00 | 1000000.00 | 1924.00 | 16.00 | 159.03 |
| PGBouncer-1-1-0-1-13 | 1.00 | 4.00 | 11264.00 | 16.00 | 0.00 | 2768.27 | 361237.00 | 1000000.00 | 1888.00 | 16.00 | 159.45 |
| PGBouncer-1-1-0-1-14 | 1.00 | 4.00 | 11264.00 | 16.00 | 0.00 | 2759.71 | 362357.00 | 1000000.00 | 2075.00 | 16.00 | 158.96 |
| PGBouncer-1-1-0-1-15 | 1.00 | 4.00 | 11264.00 | 16.00 | 0.00 | 2781.32 | 359542.00 | 1000000.00 | 1937.00 | 16.00 | 160.20 |
| PGBouncer-1-1-0-1-16 | 1.00 | 4.00 | 11264.00 | 16.00 | 0.00 | 3462.72 | 288790.00 | 1000000.00 | 1999.00 | 16.00 | 199.45 |
#### Per Run
| DBMS | experiment_run | threads | target | pod_count | exceptions | sf | Throughput [SF/h] | [OVERALL].Throughput(ops/sec) | [OVERALL].RunTime(ms) | [INSERT].Return=OK | [INSERT].99thPercentileLatency(us) |
|:--------------|-----------------:|----------:|----------:|------------:|-------------:|------:|--------------------:|--------------------------------:|------------------------:|---------------------:|-------------------------------------:|
| PGBouncer-1-1 | 1.00 | 64.00 | 180224.00 | 16.00 | 0.00 | 16.00 | 158.30 | 47403.15 | 363872.00 | 16000000.00 | 1927.38 |
### Execution
#### Per Connection
| DBMS | phase | job | configuration | experiment_run | client | benchmark_run | child | threads | target | pod_count | exceptions | [OVERALL].Throughput(ops/sec) | [OVERALL].RunTime(ms) | [READ].Return=OK | [READ].99thPercentileLatency(us) |
|:---------------------|:----------------|:------------------|:----------------|-----------------:|---------:|----------------:|--------:|----------:|---------:|------------:|-------------:|--------------------------------:|------------------------:|-------------------:|-----------------------------------:|
| PGBouncer-1-1-1-1-3 | PGBouncer-1-1-1 | PGBouncer-1-1-1-1 | PGBouncer-1 | 1 | 1 | 1 | 3 | 8 | 11264 | 16 | 0 | 3743.50 | 267130.00 | 1000000 | 2297.00 |
| PGBouncer-1-1-1-1-4 | PGBouncer-1-1-1 | PGBouncer-1-1-1-1 | PGBouncer-1 | 1 | 1 | 1 | 4 | 8 | 11264 | 16 | 0 | 3736.31 | 267644.00 | 1000000 | 2263.00 |
| PGBouncer-1-2-1-1-6 | PGBouncer-1-2-1 | PGBouncer-1-2-1-1 | PGBouncer-1 | 2 | 1 | 1 | 6 | 8 | 11264 | 16 | 0 | 3092.51 | 323362.00 | 1000000 | 2639.00 |
| PGBouncer-1-1-1-1-2 | PGBouncer-1-1-1 | PGBouncer-1-1-1-1 | PGBouncer-1 | 1 | 1 | 1 | 2 | 8 | 11264 | 16 | 0 | 3735.62 | 267693.00 | 1000000 | 2309.00 |
| PGBouncer-1-2-1-1-16 | PGBouncer-1-2-1 | PGBouncer-1-2-1-1 | PGBouncer-1 | 2 | 1 | 1 | 16 | 8 | 11264 | 16 | 0 | 3085.78 | 324067.00 | 1000000 | 2515.00 |
| PGBouncer-1-1-1-1-11 | PGBouncer-1-1-1 | PGBouncer-1-1-1-1 | PGBouncer-1 | 1 | 1 | 1 | 11 | 8 | 11264 | 16 | 0 | 3731.44 | 267993.00 | 1000000 | 2343.00 |
| PGBouncer-1-1-1-1-15 | PGBouncer-1-1-1 | PGBouncer-1-1-1-1 | PGBouncer-1 | 1 | 1 | 1 | 15 | 8 | 11264 | 16 | 0 | 3734.94 | 267742.00 | 1000000 | 2295.00 |
| PGBouncer-1-2-1-1-15 | PGBouncer-1-2-1 | PGBouncer-1-2-1-1 | PGBouncer-1 | 2 | 1 | 1 | 15 | 8 | 11264 | 16 | 0 | 3095.98 | 322999.00 | 1000000 | 2589.00 |
| PGBouncer-1-1-1-1-6 | PGBouncer-1-1-1 | PGBouncer-1-1-1-1 | PGBouncer-1 | 1 | 1 | 1 | 6 | 8 | 11264 | 16 | 0 | 3728.82 | 268181.00 | 1000000 | 2331.00 |
| PGBouncer-1-2-1-1-7 | PGBouncer-1-2-1 | PGBouncer-1-2-1-1 | PGBouncer-1 | 2 | 1 | 1 | 7 | 8 | 11264 | 16 | 0 | 3086.66 | 323975.00 | 1000000 | 2789.00 |
| PGBouncer-1-2-1-1-8 | PGBouncer-1-2-1 | PGBouncer-1-2-1-1 | PGBouncer-1 | 2 | 1 | 1 | 8 | 8 | 11264 | 16 | 0 | 3085.15 | 324133.00 | 1000000 | 2707.00 |
| PGBouncer-1-1-1-1-14 | PGBouncer-1-1-1 | PGBouncer-1-1-1-1 | PGBouncer-1 | 1 | 1 | 1 | 14 | 8 | 11264 | 16 | 0 | 3739.41 | 267422.00 | 1000000 | 2327.00 |
| PGBouncer-1-2-1-1-3 | PGBouncer-1-2-1 | PGBouncer-1-2-1-1 | PGBouncer-1 | 2 | 1 | 1 | 3 | 8 | 11264 | 16 | 0 | 3084.11 | 324243.00 | 1000000 | 2689.00 |
| PGBouncer-1-1-1-1-7 | PGBouncer-1-1-1 | PGBouncer-1-1-1-1 | PGBouncer-1 | 1 | 1 | 1 | 7 | 8 | 11264 | 16 | 0 | 3745.07 | 267018.00 | 1000000 | 2199.00 |
| PGBouncer-1-2-1-1-13 | PGBouncer-1-2-1 | PGBouncer-1-2-1-1 | PGBouncer-1 | 2 | 1 | 1 | 13 | 8 | 11264 | 16 | 0 | 3085.18 | 324130.00 | 1000000 | 2679.00 |
| PGBouncer-1-1-1-1-9 | PGBouncer-1-1-1 | PGBouncer-1-1-1-1 | PGBouncer-1 | 1 | 1 | 1 | 9 | 8 | 11264 | 16 | 0 | 3745.42 | 266993.00 | 1000000 | 2317.00 |
| PGBouncer-1-1-1-1-13 | PGBouncer-1-1-1 | PGBouncer-1-1-1-1 | PGBouncer-1 | 1 | 1 | 1 | 13 | 8 | 11264 | 16 | 0 | 3732.85 | 267892.00 | 1000000 | 2339.00 |
| PGBouncer-1-2-1-1-1 | PGBouncer-1-2-1 | PGBouncer-1-2-1-1 | PGBouncer-1 | 2 | 1 | 1 | 1 | 8 | 11264 | 16 | 0 | 3084.88 | 324162.00 | 1000000 | 2675.00 |
| PGBouncer-1-2-1-1-9 | PGBouncer-1-2-1 | PGBouncer-1-2-1-1 | PGBouncer-1 | 2 | 1 | 1 | 9 | 8 | 11264 | 16 | 0 | 3093.10 | 323300.00 | 1000000 | 2635.00 |
| PGBouncer-1-1-1-1-1 | PGBouncer-1-1-1 | PGBouncer-1-1-1-1 | PGBouncer-1 | 1 | 1 | 1 | 1 | 8 | 11264 | 16 | 0 | 3746.88 | 266889.00 | 1000000 | 2195.00 |
| PGBouncer-1-2-1-1-2 | PGBouncer-1-2-1 | PGBouncer-1-2-1-1 | PGBouncer-1 | 2 | 1 | 1 | 2 | 8 | 11264 | 16 | 0 | 3084.53 | 324198.00 | 1000000 | 2757.00 |
| PGBouncer-1-1-1-1-12 | PGBouncer-1-1-1 | PGBouncer-1-1-1-1 | PGBouncer-1 | 1 | 1 | 1 | 12 | 8 | 11264 | 16 | 0 | 3737.83 | 267535.00 | 1000000 | 2223.00 |
| PGBouncer-1-2-1-1-12 | PGBouncer-1-2-1 | PGBouncer-1-2-1-1 | PGBouncer-1 | 2 | 1 | 1 | 12 | 8 | 11264 | 16 | 0 | 3092.41 | 323372.00 | 1000000 | 2553.00 |
| PGBouncer-1-1-1-1-10 | PGBouncer-1-1-1 | PGBouncer-1-1-1-1 | PGBouncer-1 | 1 | 1 | 1 | 10 | 8 | 11264 | 16 | 0 | 3733.32 | 267858.00 | 1000000 | 2363.00 |
| PGBouncer-1-2-1-1-4 | PGBouncer-1-2-1 | PGBouncer-1-2-1-1 | PGBouncer-1 | 2 | 1 | 1 | 4 | 8 | 11264 | 16 | 0 | 3075.83 | 325116.00 | 1000000 | 2765.00 |
| PGBouncer-1-2-1-1-5 | PGBouncer-1-2-1 | PGBouncer-1-2-1-1 | PGBouncer-1 | 2 | 1 | 1 | 5 | 8 | 11264 | 16 | 0 | 3096.53 | 322942.00 | 1000000 | 2653.00 |
| PGBouncer-1-1-1-1-16 | PGBouncer-1-1-1 | PGBouncer-1-1-1-1 | PGBouncer-1 | 1 | 1 | 1 | 16 | 8 | 11264 | 16 | 0 | 3742.04 | 267234.00 | 1000000 | 2269.00 |
| PGBouncer-1-1-1-1-5 | PGBouncer-1-1-1 | PGBouncer-1-1-1-1 | PGBouncer-1 | 1 | 1 | 1 | 5 | 8 | 11264 | 16 | 0 | 3734.20 | 267795.00 | 1000000 | 2323.00 |
| PGBouncer-1-2-1-1-11 | PGBouncer-1-2-1 | PGBouncer-1-2-1-1 | PGBouncer-1 | 2 | 1 | 1 | 11 | 8 | 11264 | 16 | 0 | 3096.34 | 322962.00 | 1000000 | 2541.00 |
| PGBouncer-1-1-1-1-8 | PGBouncer-1-1-1 | PGBouncer-1-1-1-1 | PGBouncer-1 | 1 | 1 | 1 | 8 | 8 | 11264 | 16 | 0 | 3733.60 | 267838.00 | 1000000 | 2231.00 |
| PGBouncer-1-2-1-1-14 | PGBouncer-1-2-1 | PGBouncer-1-2-1-1 | PGBouncer-1 | 2 | 1 | 1 | 14 | 8 | 11264 | 16 | 0 | 3097.46 | 322845.00 | 1000000 | 2655.00 |
| PGBouncer-1-2-1-1-10 | PGBouncer-1-2-1 | PGBouncer-1-2-1-1 | PGBouncer-1 | 2 | 1 | 1 | 10 | 8 | 11264 | 16 | 0 | 3100.88 | 322489.00 | 1000000 | 2575.00 |
#### Per Phase
| DBMS | phase | experiment_run | threads | target | benchmark_run | pod_count | exceptions | [OVERALL].Throughput(ops/sec) | [OVERALL].RunTime(ms) | [READ].Return=OK | [READ].99thPercentileLatency(us) |
|:----------------|:----------------|-----------------:|----------:|---------:|----------------:|------------:|-------------:|--------------------------------:|------------------------:|-------------------:|-----------------------------------:|
| PGBouncer-1-1-1 | PGBouncer-1-1-1 | 1 | 128 | 180224 | 1 | 16 | 0 | 59801.23 | 268181.00 | 16000000 | 2363.00 |
| PGBouncer-1-2-1 | PGBouncer-1-2-1 | 2 | 128 | 180224 | 1 | 16 | 0 | 49437.34 | 325116.00 | 16000000 | 2789.00 |
### Monitoring
### Loading phase: component pool
| DBMS | CPU [CPUs] | Max CPU | Max RAM [Gb] | Max RAM Cached [Gb] |
|:------------------|-------------:|----------:|---------------:|----------------------:|
| PGBouncer-1-1-1-1 | 0.26 | 0.00 | 0.04 | 0.04 |
### Loading phase: SUT deployment
| DBMS | CPU [CPUs] | Max CPU | Max RAM [Gb] | Max RAM Cached [Gb] |
|:------------------|-------------:|----------:|---------------:|----------------------:|
| PGBouncer-1-1-1-1 | 2144.32 | 8.21 | 23.98 | 42.24 |
### Loading phase: component loader
| DBMS | CPU [CPUs] | Max CPU | Max RAM [Gb] | Max RAM Cached [Gb] |
|:------------------|-------------:|----------:|---------------:|----------------------:|
| PGBouncer-1-1-1-1 | 1284.22 | 6.37 | 0.11 | 0.11 |
### Execution phase: component pool
| DBMS | CPU [CPUs] | Max CPU | Max RAM [Gb] | Max RAM Cached [Gb] |
|:------------------|-------------:|----------:|---------------:|----------------------:|
| PGBouncer-1-1-1-1 | 0.08 | 0.00 | 0.04 | 0.04 |
| PGBouncer-1-2-1-1 | 0.16 | 0.00 | 0.04 | 0.04 |
### Execution phase: SUT deployment
| DBMS | CPU [CPUs] | Max CPU | Max RAM [Gb] | Max RAM Cached [Gb] |
|:------------------|-------------:|----------:|---------------:|----------------------:|
| PGBouncer-1-1-1-1 | 1607.92 | 8.78 | 26.23 | 44.49 |
| PGBouncer-1-2-1-1 | 1736.18 | 9.02 | 24.89 | 43.13 |
### Execution phase: component benchmarker
| DBMS | CPU [CPUs] | Max CPU | Max RAM [Gb] | Max RAM Cached [Gb] |
|:------------------|-------------:|----------:|---------------:|----------------------:|
| PGBouncer-1-1-1-1 | 1105.78 | 7.25 | 0.11 | 0.11 |
| PGBouncer-1-2-1-1 | 1082.55 | 6.70 | 0.11 | 0.11 |
### Tests
* TEST passed: Loading phase: component pool contains no 0 or NaN in CPU [CPUs]
* TEST passed: Loading phase: SUT deployment contains no 0 or NaN in CPU [CPUs]
* TEST passed: Loading phase: component loader contains no 0 or NaN in CPU [CPUs]
* TEST passed: Execution phase: component pool contains no 0 or NaN in CPU [CPUs]
* TEST passed: Execution phase: SUT deployment contains no 0 or NaN in CPU [CPUs]
* TEST passed: Execution phase: component benchmarker contains no 0 or NaN in CPU [CPUs]
* TEST passed: Loading Phase: [OVERALL].Throughput(ops/sec) contains no 0 or NaN
* TEST passed: Execution Phase: [OVERALL].Throughput(ops/sec) contains no 0 or NaN
* TEST passed: Workflow as planned
* TEST passed: Execution Phase: contains no FAILED column
YCSB Example Explained
Configuration of Bexhoma
In cluster.config there is a section:
'PGBouncer': {
    'loadData': 'psql -U postgres < {scriptname}',
    'template': {
        'version': 'v11.4',
        'alias': 'General-B',
        'docker_alias': 'GP-B',
         'JDBC': {
            'driver': "org.postgresql.Driver",
            'auth': ["postgres", ""],
            'url': 'jdbc:postgresql://{serverip}:9091/postgres?reWriteBatchedInserts=true',
            'jar': 'postgresql-42.5.0.jar'
        }
    },
    'logfile': '/usr/local/data/logfile',
    'datadir': '/var/lib/postgresql/data/',
    'priceperhourdollar': 0.0,
},
where
loadData: This command is used to create the schemaJDBC: These infos are used to configure YCSB
Schema SQL File
Before ingestion, we run a script to create and distribute the tables: https://github.com/Beuth-Erdelt/Benchmark-Experiment-Host-Manager/tree/master/experiments/ycsb/PostgreSQL/initschema-ycsb.sql
After ingestion, we run a script to check the distributions. The script also vacuums and analyzes the tables: https://github.com/Beuth-Erdelt/Benchmark-Experiment-Host-Manager/blob/master/experiments/ycsb/PostgreSQL/checkschema-ycsb.sql
Benchbase’s TPC-C
Benchbase allows to activate new-connection-per-transaction [1]. The default value is “false” [2]. When activated, after each transaction the connections is closed [3]. A new connection will be opened right before the next transaction. This behavior can be expected to affect throughput and latency. It can also be expected that a connection pooler like PGBouncer will help here.
Example: https://illuminatedcomputing.com/posts/2024/08/benchbase-documentation/
Default value: https://github.com/cmu-db/benchbase/blob/main/src/main/java/com/oltpbenchmark/DBWorkload.java#L143
Implementation: https://github.com/cmu-db/benchbase/blob/main/src/main/java/com/oltpbenchmark/api/Worker.java
Benchbase Reconnect
TPC-C is performed at 16 warehouses.
The 16 threads of the client are split into a cascading sequence of 1 and 2 pods.
We activate the new-connection-per-transaction feature with -xconn.
bexhoma benchbase \
  -dbms PostgreSQL \
  -sf 16 \
  -xsd 10 \
  -xtb 1024 \
  -xnbf 16 \
  -nbp 1,2 \
  -nbt 32 \
  -xconn \
  -ms $BEXHOMA_MS \
  -tr \
  -rss 50Gi \
  -rnn $BEXHOMA_NODE_SUT -rnl $BEXHOMA_NODE_LOAD -rnb $BEXHOMA_NODE_BENCHMARK \
  run &>$LOG_DIR/docs_benchbase_pgbouncer_newconn.log
Evaluate Results
docs_benchbase_pgbouncer_newconn.log
## Show Summary

### Workload
Benchbase Workload tpcc SF=16
* Type: benchbase
* Duration: 1706s
* Code: 1782222389
* Benchbase runs a TPC-C experiment.
* This experiment compares run time and resource consumption of Benchbase queries in different DBMS.
  * Benchbase data is generated and loaded using several threads.
  * Benchmark is 'tpcc'. Scaling factor is 16. Target is based on multiples of '1024'. Factors for benchmarking are [16]. There is a reconnect for each transaction. Benchmarking runs for 10 minutes.
  * Experiment uses bexhoma version 0.10.0.
  * Experiment is limited to DBMS ['PostgreSQL'].
  * Import is handled by 1 processes (pods).
  * Loading is fixed to cl-worker19.
  * Benchmarking is fixed to cl-worker19.
  * SUT is fixed to cl-worker38.
  * Database uses ephemeral storage of size 10Gi.
  * Loading is tested with [1] threads, split into [1] pods.
  * Benchmarking is tested with [32] threads, split into [1, 2] pods.
  * Benchmarking is run as [1] times the number of benchmarking pods.
  * Experiment is run once.

### Connections
* PostgreSQL-1-1-1-1 uses docker image postgres:18.3
  * RAM:540492877824
  * CPU:Intel(R) Xeon(R) Gold 6430
  * Cores:128
  * host:6.8.0-111-generic
  * node:cl-worker38
  * disk:229294
  * datadisk:4307
  * cpu_list:0-127
  * args:['-c', 'max_connections=640', '-c', 'max_worker_processes=16', '-c', 'max_parallel_workers=16', '-c', 'max_parallel_workers_per_gather=8', '-c', 'max_parallel_maintenance_workers=4', '-c', 'shared_buffers=16GB', '-c', 'effective_cache_size=40GB', '-c', 'work_mem=512MB', '-c', 'maintenance_work_mem=2GB', '-c', 'autovacuum=off', '-c', 'wal_level=minimal', '-c', 'max_wal_senders=0', '-c', 'max_wal_size=32GB', '-c', 'checkpoint_timeout=1h', '-c', 'checkpoint_completion_target=1.0', '-c', 'lock_timeout=30s', '-c', 'idle_in_transaction_session_timeout=30000']
  * requests_cpu:4
  * requests_memory:16Gi
  * eval_parameters
    * code:1782222389
    * TENANT_VOL:False
* PostgreSQL-1-1-2-1 uses docker image postgres:18.3
  * RAM:540492877824
  * CPU:Intel(R) Xeon(R) Gold 6430
  * Cores:128
  * host:6.8.0-111-generic
  * node:cl-worker38
  * disk:229716
  * datadisk:4730
  * cpu_list:0-127
  * args:['-c', 'max_connections=640', '-c', 'max_worker_processes=16', '-c', 'max_parallel_workers=16', '-c', 'max_parallel_workers_per_gather=8', '-c', 'max_parallel_maintenance_workers=4', '-c', 'shared_buffers=16GB', '-c', 'effective_cache_size=40GB', '-c', 'work_mem=512MB', '-c', 'maintenance_work_mem=2GB', '-c', 'autovacuum=off', '-c', 'wal_level=minimal', '-c', 'max_wal_senders=0', '-c', 'max_wal_size=32GB', '-c', 'checkpoint_timeout=1h', '-c', 'checkpoint_completion_target=1.0', '-c', 'lock_timeout=30s', '-c', 'idle_in_transaction_session_timeout=30000']
  * requests_cpu:4
  * requests_memory:16Gi
  * eval_parameters
    * code:1782222389
    * TENANT_VOL:False

### Workflow

#### Actual

* DBMS PostgreSQL-1 - Experiment 1 Client 1: benchbase (1 pods)
* DBMS PostgreSQL-1 - Experiment 1 Client 2: benchbase (2 pods)

#### Planned

* DBMS PostgreSQL-1 - Experiment 1 Client 1: benchbase (1 pods)
* DBMS PostgreSQL-1 - Experiment 1 Client 2: benchbase (2 pods)

### Loading

#### Per Run

|                |   experiment_run |   SF |   time_load |   time_preload |   time_generate |   time_ingest |   time_postload |   loading_pods |   terminals | tenant_id   | type_tenants   |   num_tenants | vol_tenants   |   Throughput [SF/h] |
|:---------------|-----------------:|-----:|------------:|---------------:|----------------:|--------------:|----------------:|---------------:|------------:|:------------|:---------------|--------------:|:--------------|--------------------:|
| PostgreSQL-1-1 |                1 |   16 |      309.00 |           1.00 |            0.00 |        142.00 |          166.00 |              1 |           1 |             |                |             0 | False         |              186.41 |

### Execution

#### Per Connection

| DBMS                 | phase            | job                |   experiment_run |   terminals |   target |   client |   benchmark_run |   child |   tenant_id |   time |   num_errors |   Throughput (requests/second) |   Goodput (requests/second) |   efficiency |   Latency Distribution.95th Percentile Latency (microseconds) |   Latency Distribution.Average Latency (microseconds) |
|:---------------------|:-----------------|:-------------------|-----------------:|------------:|---------:|---------:|----------------:|--------:|------------:|-------:|-------------:|-------------------------------:|----------------------------:|-------------:|--------------------------------------------------------------:|------------------------------------------------------:|
| PostgreSQL-1-1-1-1-1 | PostgreSQL-1-1-1 | PostgreSQL-1-1-1-1 |                1 |          32 |    16384 |        1 |               1 |       1 |           0 | 600.00 |            2 |                        1559.79 |                      467.71 |         0.00 |                                                      24220.00 |                                              20511.00 |
| PostgreSQL-1-1-2-1-1 | PostgreSQL-1-1-2 | PostgreSQL-1-1-2-1 |                1 |          16 |     8192 |        2 |               1 |       1 |           0 | 600.00 |            0 |                         719.24 |                      454.10 |         0.00 |                                                      36415.00 |                                              22239.00 |
| PostgreSQL-1-1-2-1-2 | PostgreSQL-1-1-2 | PostgreSQL-1-1-2-1 |                1 |          16 |     8192 |        2 |               1 |       2 |           0 | 600.00 |            0 |                         701.28 |                      454.34 |         0.00 |                                                      37416.00 |                                              22808.00 |

#### Per Phase

| DBMS             | phase            |   experiment_run |   terminals |   target |   benchmark_run |   pod_count |   tenant_id |   time |   num_errors |   Throughput (requests/second) |   Goodput (requests/second) |   efficiency |   Latency Distribution.95th Percentile Latency (microseconds) |   Latency Distribution.Average Latency (microseconds) |
|:-----------------|:-----------------|-----------------:|------------:|---------:|----------------:|------------:|------------:|-------:|-------------:|-------------------------------:|----------------------------:|-------------:|--------------------------------------------------------------:|------------------------------------------------------:|
| PostgreSQL-1-1-1 | PostgreSQL-1-1-1 |                1 |          32 |    16384 |               1 |           1 |           0 | 600.00 |            2 |                        1559.79 |                      467.71 |         0.00 |                                                      24220.00 |                                              20511.00 |
| PostgreSQL-1-1-2 | PostgreSQL-1-1-2 |                1 |          32 |    16384 |               1 |           2 |           0 | 600.00 |            0 |                        1420.53 |                      908.44 |         0.00 |                                                      37416.00 |                                              22523.50 |

### Tests
* TEST passed: Throughput (requests/second) contains no 0 or NaN
* TEST passed: Workflow as planned
Benchbase Reconnect via Pool
TPC-C is performed at 16 warehouses. The 16 threads of the client are split into a cascading sequence of 1 and 2 pods. We activate the new-connection-per-transaction feature. This time there will be a connection pool of size 32, handled by 2 pods of PGBouncer.
bexhoma benchbase \
  -dbms PGBouncer \
  -sf 16 \
  -xsd 10 \
  -xtb 1024 \
  -xnbf 16 \
  -nbp 1,2 \
  -nbt 32 \
  -xnpp 2 \
  -xnpi 32 \
  -xnpo 32 \
  -xconn \
  -ms $BEXHOMA_MS \
  -tr \
  -rss 50Gi \
  -rnn $BEXHOMA_NODE_SUT -rnl $BEXHOMA_NODE_LOAD -rnb $BEXHOMA_NODE_BENCHMARK \
  run &>$LOG_DIR/docs_benchbase_pgbouncer_newconn_pool.log
Evaluate Results
docs_benchbase_pgbouncer_newconn_pool.log
## Show Summary

### Workload
Benchbase Workload tpcc SF=16
* Type: benchbase
* Duration: 1640s
* Code: 1782224097
* Benchbase runs a TPC-C experiment.
* This experiment compares run time and resource consumption of Benchbase queries in different DBMS.
  * Benchbase data is generated and loaded using several threads.
  * Benchmark is 'tpcc'. Scaling factor is 16. Target is based on multiples of '1024'. Factors for benchmarking are [16]. There is a reconnect for each transaction. Benchmarking runs for 10 minutes.
  * Experiment uses bexhoma version 0.10.0.
  * Experiment is limited to DBMS ['PGBouncer'].
  * Import is handled by 1 processes (pods).
  * Loading is fixed to cl-worker19.
  * Benchmarking is fixed to cl-worker19.
  * SUT is fixed to cl-worker38.
  * Database uses ephemeral storage of size 10Gi.
  * Loading is tested with [1] threads, split into [1] pods.
  * Benchmarking is tested with [32] threads, split into [1, 2] pods.
  * Pooling is done with [2] pods having [32] inbound and [32] outbound connections in total.
  * Benchmarking is run as [1] times the number of benchmarking pods.
  * Experiment is run once.

### Connections
* PGBouncer-1-1-1-1 uses docker image postgres:18.3
  * RAM:540492877824
  * CPU:Intel(R) Xeon(R) Gold 6430
  * Cores:128
  * host:6.8.0-111-generic
  * node:cl-worker38
  * disk:257622
  * datadisk:4309
  * cpu_list:0-127
  * args:['-c', 'max_worker_processes=64', '-c', 'max_parallel_workers=64', '-c', 'max_parallel_workers_per_gather=64', '-c', 'max_parallel_maintenance_workers=64', '-c', 'max_wal_size=32GB', '-c', 'shared_buffers=64GB', '-c', 'max_connections=2048', '-c', 'autovacuum_max_workers=10', '-c', 'autovacuum_vacuum_cost_limit=3000', '-c', 'vacuum_cost_limit=1000', '-c', 'checkpoint_completion_target=0.9', '-c', 'cpu_tuple_cost=0.03', '-c', 'effective_cache_size=64GB', '-c', 'maintenance_work_mem=2GB', '-c', 'wal_buffers=1GB', '-c', 'work_mem=32GB', '-c', 'temp_buffers=4GB', '-c', 'autovacuum_work_mem=-1', '-c', 'max_stack_depth=7MB', '-c', 'max_files_per_process=4000', '-c', 'effective_io_concurrency=32', '-c', 'wal_level=minimal', '-c', 'max_wal_senders=0', '-c', 'synchronous_commit=off', '-c', 'checkpoint_timeout=1h', '-c', 'checkpoint_warning=0', '-c', 'autovacuum=off', '-c', 'max_locks_per_transaction=64', '-c', 'max_pred_locks_per_transaction=64', '-c', 'default_statistics_target=1000', '-c', 'random_page_cost=60']
  * requests_cpu:4
  * requests_memory:16Gi
  * eval_parameters
    * code:1782224097
* PGBouncer-1-1-2-1 uses docker image postgres:18.3
  * RAM:540492877824
  * CPU:Intel(R) Xeon(R) Gold 6430
  * Cores:128
  * host:6.8.0-111-generic
  * node:cl-worker38
  * disk:257899
  * datadisk:4586
  * cpu_list:0-127
  * args:['-c', 'max_worker_processes=64', '-c', 'max_parallel_workers=64', '-c', 'max_parallel_workers_per_gather=64', '-c', 'max_parallel_maintenance_workers=64', '-c', 'max_wal_size=32GB', '-c', 'shared_buffers=64GB', '-c', 'max_connections=2048', '-c', 'autovacuum_max_workers=10', '-c', 'autovacuum_vacuum_cost_limit=3000', '-c', 'vacuum_cost_limit=1000', '-c', 'checkpoint_completion_target=0.9', '-c', 'cpu_tuple_cost=0.03', '-c', 'effective_cache_size=64GB', '-c', 'maintenance_work_mem=2GB', '-c', 'wal_buffers=1GB', '-c', 'work_mem=32GB', '-c', 'temp_buffers=4GB', '-c', 'autovacuum_work_mem=-1', '-c', 'max_stack_depth=7MB', '-c', 'max_files_per_process=4000', '-c', 'effective_io_concurrency=32', '-c', 'wal_level=minimal', '-c', 'max_wal_senders=0', '-c', 'synchronous_commit=off', '-c', 'checkpoint_timeout=1h', '-c', 'checkpoint_warning=0', '-c', 'autovacuum=off', '-c', 'max_locks_per_transaction=64', '-c', 'max_pred_locks_per_transaction=64', '-c', 'default_statistics_target=1000', '-c', 'random_page_cost=60']
  * requests_cpu:4
  * requests_memory:16Gi
  * eval_parameters
    * code:1782224097

### Workflow

#### Actual

* DBMS PGBouncer-1 - Experiment 1 Client 1: benchbase (1 pods)
* DBMS PGBouncer-1 - Experiment 1 Client 2: benchbase (2 pods)

#### Planned

* DBMS PGBouncer-1 - Experiment 1 Client 1: benchbase (1 pods)
* DBMS PGBouncer-1 - Experiment 1 Client 2: benchbase (2 pods)

### Loading

#### Per Run

|               |   experiment_run |   SF |   time_load |   time_preload |   time_generate |   time_ingest |   time_postload |   loading_pods |   terminals | tenant_id   | type_tenants   |   num_tenants | vol_tenants   |   Throughput [SF/h] |
|:--------------|-----------------:|-----:|------------:|---------------:|----------------:|--------------:|----------------:|---------------:|------------:|:------------|:---------------|--------------:|:--------------|--------------------:|
| PGBouncer-1-1 |                1 |   16 |      313.00 |           1.00 |            0.00 |        136.00 |          176.00 |              1 |           1 |             | None           |             0 | False         |              184.03 |

### Execution

#### Per Connection

| DBMS                | phase           | job               |   experiment_run |   terminals |   target |   client |   benchmark_run |   child |   tenant_id |   time |   num_errors |   Throughput (requests/second) |   Goodput (requests/second) |   efficiency |   Latency Distribution.95th Percentile Latency (microseconds) |   Latency Distribution.Average Latency (microseconds) |
|:--------------------|:----------------|:------------------|-----------------:|------------:|---------:|---------:|----------------:|--------:|------------:|-------:|-------------:|-------------------------------:|----------------------------:|-------------:|--------------------------------------------------------------:|------------------------------------------------------:|
| PGBouncer-1-1-1-1-1 | PGBouncer-1-1-1 | PGBouncer-1-1-1-1 |                1 |          32 |    16384 |        1 |               1 |       1 |          -1 | 600.00 |            2 |                        1473.01 |                      467.70 |         0.00 |                                                      42381.00 |                                              21720.00 |
| PGBouncer-1-1-2-1-1 | PGBouncer-1-1-2 | PGBouncer-1-1-2-1 |                1 |          16 |     8192 |        2 |               1 |       1 |          -1 | 600.00 |            1 |                         673.06 |                      448.73 |         0.00 |                                                      51332.00 |                                              23765.00 |
| PGBouncer-1-1-2-1-2 | PGBouncer-1-1-2 | PGBouncer-1-1-2-1 |                1 |          16 |     8192 |        2 |               1 |       2 |          -1 | 600.00 |            2 |                         663.74 |                      448.50 |         0.00 |                                                      51240.00 |                                              24098.00 |

#### Per Phase

| DBMS            | phase           |   experiment_run |   terminals |   target |   benchmark_run |   pod_count |   tenant_id |   time |   num_errors |   Throughput (requests/second) |   Goodput (requests/second) |   efficiency |   Latency Distribution.95th Percentile Latency (microseconds) |   Latency Distribution.Average Latency (microseconds) |
|:----------------|:----------------|-----------------:|------------:|---------:|----------------:|------------:|------------:|-------:|-------------:|-------------------------------:|----------------------------:|-------------:|--------------------------------------------------------------:|------------------------------------------------------:|
| PGBouncer-1-1-1 | PGBouncer-1-1-1 |                1 |          32 |    16384 |               1 |           1 |          -1 | 600.00 |            2 |                        1473.01 |                      467.70 |         0.00 |                                                      42381.00 |                                              21720.00 |
| PGBouncer-1-1-2 | PGBouncer-1-1-2 |                1 |          32 |    16384 |               1 |           2 |          -1 | 600.00 |            3 |                        1336.80 |                      897.23 |         0.00 |                                                      51332.00 |                                              23931.50 |

### Tests
* TEST passed: Throughput (requests/second) contains no 0 or NaN
* TEST passed: Workflow as planned